Dollar General 2008 Annual Report Download - page 27
Download and view the complete annual report
Please find page 27 of the 2008 Dollar General annual report below. You can navigate through the pages in the report by either clicking on the pages listed below, or by using the keyword search tool below to find specific information within the annual report.25
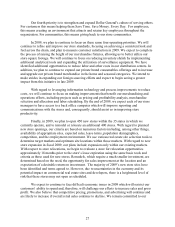
At the beginning of 2008, we defined four operating priorities as follows: 1) drive
productive sales growth, 2) increase our gross margins, 3) leverage process improvements and
information technology to reduce costs, and 4) strengthen and expand Dollar General's culture of
serving others. These continue to be our principal operating priorities in 2009. Coupled with the
changes we made to our operations during the year in connection with these priorities, which are
discussed in more detail below, we achieved the following financial highlights in fiscal 2008:
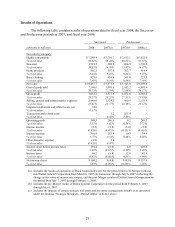
• Total sales in fiscal 2008 were $10.5 billion, a 10.1% increase from 2007. Sales in
same-stores increased 9.0% and were driven by increases in customer traffic and
average transaction amount. Average sales per square foot for all stores in 2008 were
approximately $180, up from $165 in 2007. Sales increases of highly consumable
products outpaced our more discretionary categories, likely the result of both our
merchandising initiatives, which were more focused on consumables, and the
negative effect of the economy on consumer discretionary spending.
• Gross profit, as a percentage of sales, was 29.3% in 2008. During the year, we made
progress in reducing our inventory shrinkage and improving the efficiencies of our
distribution and transportation processes as well as leveraging fixed distribution costs.
Improvements in our pricing systems and processes also permitted us to make more
timely price changes to compensate for unavoidable cost increases, and for the year,
markdowns declined.
• SG&A, as a percentage of sales, for fiscal 2008 was 23.4%. This compares to 23.8%
in the 2007 Successor period and 24.5% in the 2007 Predecessor period. Our
increased sales levels favorably impacted SG&A, as a percentage of sales, in addition
to a reduction in workers’ compensation expense, resulting from safety initiatives
implemented over the last several years, and reduced advertising expense. The 2007
Predecessor period included SG&A of $45.0 million, or 115 basis points, related to
closing underperforming stores.
• We recorded litigation expense of $32 million to reflect the settlement and related
expenses, net of insurance proceeds, of a class action lawsuit filed as a result of the
Merger in 2007. We determined that the settlement was in our best interests to avoid
costly and time consuming litigation.
• Interest expense of $391.9 million in 2008 relates primarily to interest on debt
incurred to finance the Merger. We repaid all borrowings under our revolving credit
facility in the first quarter of 2008 and incurred no additional borrowings during the
year. In January 2009, we further reduced our total long-term obligations by
repurchasing $44.1 million of senior subordinated notes.
• For fiscal 2008, we reported net income of $108.2 million. This compares to a net
loss of $4.8 million in the 2007 Successor period and a net loss of $8.0 million in the
2007 Predecessor period, each of which included significant costs related to the
Merger and other strategic initiatives as more fully described in the discussion below
of 2008 vs 2007.


