Delta Airlines 2007 Annual Report Download - page 52
Download and view the complete annual report
Please find page 52 of the 2007 Delta Airlines annual report below. You can navigate through the pages in the report by either clicking on the pages listed below, or by using the keyword search tool below to find specific information within the annual report.-
 1
1 -
2
-
3
-
4
-
5
-
6
-
7
-
8
-
9
-
10
-
11
-
12
-
13
-
14
-
15
-
16
-
17
-
18
-
19
-
20
-
21
-
22
-
23
-
24
-
25
-
26
-
27
-
28
-
29
-
30
-
31
-
32
-
33
-
34
-
35
-
36
-
37
-
38
-
39
-
40
-
41
-
 42
42 -
 43
43 -
 44
44 -
 45
45 -
 46
46 -
 47
47 -
 48
48 -
 49
49 -
 50
50 -
 51
51 -
 52
52 -
 53
53 -
 54
54 -
 55
55 -
 56
56 -
 57
57 -
 58
58 -
 59
59 -
 60
60 -
 61
61 -
 62
62 -
63
-
64
-
65
-
66
-
67
-
68
-
69
-
70
-
71
-
72
-
73
-
74
-
75
-
76
-
77
-
78
-
79
-
80
-
81
-
82
-
83
-
84
-
85
-
86
-
87
-
88
-
89
-
90
-
91
-
92
-
93
-
94
-
95
-
96
-
97
-
98
-
99
-
100
-
101
-
102
-
103
-
104
-
105
-
106
-
107
-
108
-
109
-
110
-
111
-
112
-
113
-
114
-
115
-
116
-
117
-
118
-
119
-
120
-
121
-
122
-
123
-
124
-
125
-
126
-
127
-
128
-
129
-
130
-
131
-
132
-
133
-
134
-
135
-
136
-
137
-
138
-
139
-
140
 |
 |

Table of Contents
Index to Financial Statements
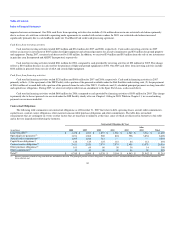
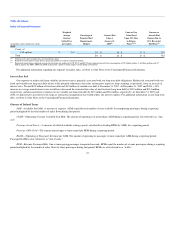
(in millions, unless otherwise stated)
Weighted
Average
Contract
Strike Price
per Gallon
Percentage of
Projected Fuel
Requirements
Hedged
Contract Fair
Value at
January 31,
2008(1)
Contract Fair
Value Based
Upon 10% Rise
in Futures
Prices(1)(2)
Increase in
Aircraft Fuel
Expense Due to
10% Rise in Jet
Fuel Price(3)
2010
Crude oil
Call options $ 2.04 2% $ 16 $ 17 $ 787
Total 2% $ 16 $ 17 $ 787
(1) Contract fair value includes the cost of premiums paid.
(2) Projection based upon average futures prices per gallon by contract settlement month.
(3) Projection based upon estimated average jet fuel price per gallon of $2.70, $2.81 and $2.93 and estimated aircraft fuel consumption of 2.5 billion gallons, 2.6 billion gallons and 2.7
billion gallons for 2008, 2009 and 2010, respectively, inclusive of the impact of fuel hedge instruments.
For additional information regarding our exposure to market risks, see Note 4 of the Notes to the Consolidated Financial Statements.
Interest Rate Risk
Our exposure to market risk from volatility in interest rates is primarily associated with our long-term debt obligations. Market risk associated with our
fixed and variable rate long-term debt relates to the potential reduction in fair value and negative impact to future earnings, respectively, from an increase in
interest rates. We had $4.5 billion of fixed-rate debt and $3.8 billion of variable-rate debt at December 31, 2007. At December 31, 2007 and 2006, a 10%
increase in average annual interest rates would have decreased the estimated fair value of our fixed-rate long-term debt by $332 million and $114 million,
respectively, and increased interest expense on our variable-rate long-term debt by $19 million and $24 million, respectively. At December 31, 2007 and
2006, we did not have any interest rate swaps or contractual arrangements that would reduce our interest expense. For additional information on our long-term
debt, see Note 6 of the Notes to the Consolidated Financial Statements.
Glossary of Defined Terms
ASM—Available Seat Mile. A measure of capacity. ASMs equal the total number of seats available for transporting passengers during a reporting
period multiplied by the total number of miles flown during that period.
CASM—(Operating) Cost per Available Seat Mile. The amount of operating cost incurred per ASM during a reporting period, also referred to as "unit
cost".
Passenger Load Factor—A measure of utilized available seating capacity calculated by dividing RPMs by ASMs for a reporting period.
Passenger Mile Yield—The amount of passenger revenue earned per RPM during a reporting period.
RASM—(Operating or Passenger) Revenue per ASM. The amount of operating or passenger revenue earned per ASM during a reporting period.
Passenger RASM is also referred to as "unit revenue."
RPM—Revenue Passenger Mile. One revenue-paying passenger transported one mile. RPMs equal the number of revenue passengers during a reporting
period multiplied by the number of miles flown by those passengers during that period, RPMs are also referred to as "traffic".
47