Delta Airlines 2007 Annual Report Download - page 115
Download and view the complete annual report
Please find page 115 of the 2007 Delta Airlines annual report below. You can navigate through the pages in the report by either clicking on the pages listed below, or by using the keyword search tool below to find specific information within the annual report.-
 1
1 -
2
-
3
-
4
-
5
-
6
-
7
-
8
-
9
-
10
-
11
-
12
-
13
-
14
-
15
-
16
-
17
-
18
-
19
-
20
-
21
-
22
-
23
-
24
-
25
-
26
-
27
-
28
-
29
-
30
-
31
-
32
-
33
-
34
-
35
-
36
-
37
-
38
-
39
-
40
-
41
-
42
-
43
-
44
-
45
-
46
-
47
-
48
-
49
-
50
-
51
-
52
-
53
-
54
-
55
-
56
-
57
-
58
-
59
-
60
-
61
-
62
-
63
-
64
-
65
-
66
-
67
-
68
-
69
-
70
-
71
-
72
-
73
-
74
-
75
-
76
-
77
-
78
-
79
-
80
-
81
-
82
-
83
-
84
-
85
-
86
-
87
-
88
-
89
-
90
-
91
-
92
-
93
-
94
-
95
-
96
-
97
-
98
-
99
-
100
-
101
-
102
-
103
-
104
-
 105
105 -
 106
106 -
 107
107 -
 108
108 -
 109
109 -
 110
110 -
 111
111 -
 112
112 -
 113
113 -
 114
114 -
 115
115 -
 116
116 -
 117
117 -
 118
118 -
 119
119 -
 120
120 -
 121
121 -
 122
122 -
 123
123 -
 124
124 -
 125
125 -
126
-
127
-
128
-
129
-
130
-
131
-
132
-
133
-
134
-
135
-
136
-
137
-
138
-
139
-
140
 |
 |

Table of Contents
Index to Financial Statements
NOTES TO THE CONSOLIDATED FINANCIAL STATEMENTS—(Continued)
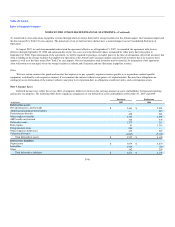
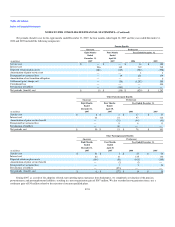
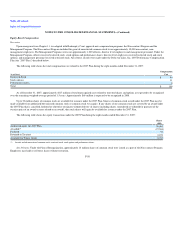
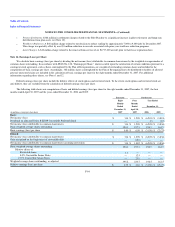
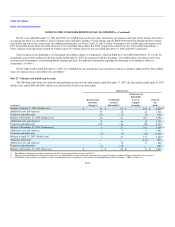
Assumed healthcare cost trend rates have an effect on the amounts reported for the other postretirement benefit plans. A 1% change in the healthcare
cost trend rate used in measuring the APBO for these plans at December 31, 2007, would have the following effects:
(in millions)
1%
Increase
1%
Decrease
Increase (decrease) in total service and interest cost $ 23 $ (4)
Increase (decrease) in the APBO 3 (40)
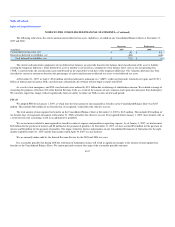
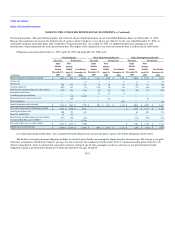
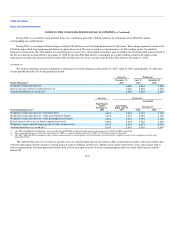
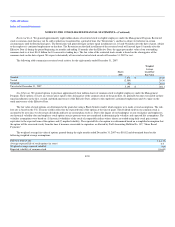
Pension Plan Assets
The weighted-average asset allocation for our pension plans at December 31, 2007 and September 30, 2006 is as follows:
Successor Predecessor
2007 2006
U.S. equity securities 35% 34%
Non-U.S. equity securities 15% 14%
High quality bonds 20% 18%
Convertible and high yield bonds 8% 8%
Private equity 15% 17%
Real estate 7% 9%
Total 100% 100%
The investment strategy for pension plan assets is to utilize a diversified mix of global public and private equity portfolios, public and private fixed
income portfolios, and private real estate and natural resource investments to earn a long-term investment return that meets or exceeds a 9% annualized return
target. The overall asset mix of the portfolio is more heavily weighted in equity-like investments, including portions of the bond portfolio, which consist of
convertible and high yield securities. Active management strategies are utilized throughout the program in an effort to realize investment returns in excess of
market indices. Also, option and currency overlay strategies are used in an effort to generate modest amounts of additional income. A bond duration extension
program utilizing fixed income derivatives is employed in an effort to better align the market value movements of a portion of the pension plan assets to the
related pension plan liabilities.
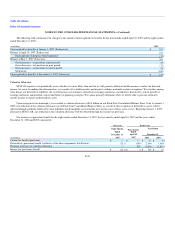
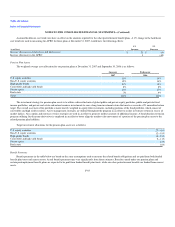
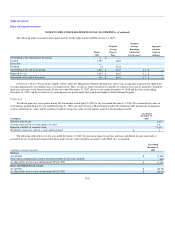
Target investment allocations for the pension plan assets are as follows:
U.S. equity securities 27—41%
Non-U.S. equity securities 12—18%
High quality bonds 15—21%
Convertible and high yield bonds 5—11%
Private equity 15%
Real estate 10%
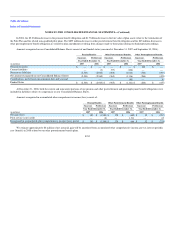
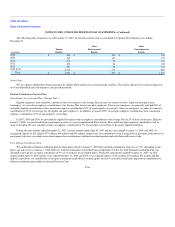
Benefit Payments
Benefit payments in the table below are based on the same assumptions used to measure the related benefit obligations and are paid from both funded
benefit plan trusts and current assets. Actual benefit payments may vary significantly from these estimates. Benefits earned under our pension plans and
certain postemployment benefit plans are expected to be paid from funded benefit plan trusts, while our other postretirement benefits are funded from current
assets.
F-55