Delta Airlines 2007 Annual Report Download - page 29
Download and view the complete annual report
Please find page 29 of the 2007 Delta Airlines annual report below. You can navigate through the pages in the report by either clicking on the pages listed below, or by using the keyword search tool below to find specific information within the annual report.-
 1
1 -
2
-
3
-
4
-
5
-
6
-
7
-
8
-
9
-
10
-
11
-
12
-
13
-
14
-
15
-
16
-
17
-
18
-
 19
19 -
 20
20 -
 21
21 -
 22
22 -
 23
23 -
 24
24 -
 25
25 -
 26
26 -
 27
27 -
 28
28 -
 29
29 -
 30
30 -
 31
31 -
 32
32 -
 33
33 -
 34
34 -
 35
35 -
 36
36 -
 37
37 -
 38
38 -
 39
39 -
40
-
41
-
42
-
43
-
44
-
45
-
46
-
47
-
48
-
49
-
50
-
51
-
52
-
53
-
54
-
55
-
56
-
57
-
58
-
59
-
60
-
61
-
62
-
63
-
64
-
65
-
66
-
67
-
68
-
69
-
70
-
71
-
72
-
73
-
74
-
75
-
76
-
77
-
78
-
79
-
80
-
81
-
82
-
83
-
84
-
85
-
86
-
87
-
88
-
89
-
90
-
91
-
92
-
93
-
94
-
95
-
96
-
97
-
98
-
99
-
100
-
101
-
102
-
103
-
104
-
105
-
106
-
107
-
108
-
109
-
110
-
111
-
112
-
113
-
114
-
115
-
116
-
117
-
118
-
119
-
120
-
121
-
122
-
123
-
124
-
125
-
126
-
127
-
128
-
129
-
130
-
131
-
132
-
133
-
134
-
135
-
136
-
137
-
138
-
139
-
140
 |
 |
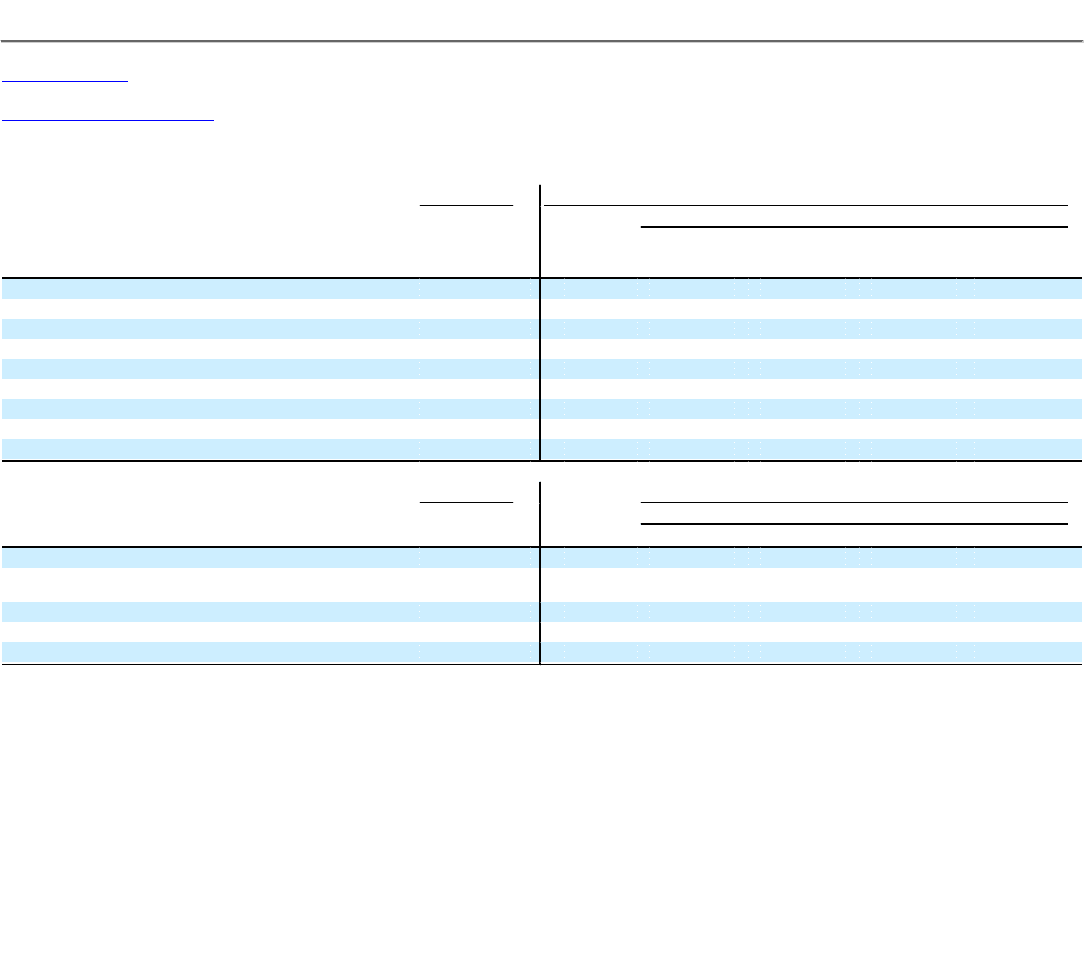
Table of Contents
Index to Financial Statements
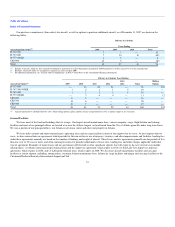
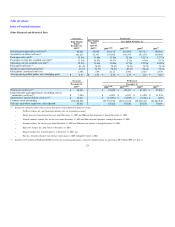
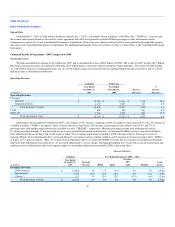
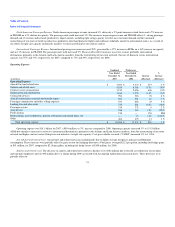
Other Financial and Statistical Data
Successor Predecessor
Eight Months
Ended
December 31,
2007(2)
Four Months
Ended
April 30,
2007(3)
Year Ended December 31,
2006(4)(10) 2005(5)(10) 2004(6) 2003(7)
Revenue passenger miles (millions)(1) 85,029 37,036 116,133 119,954 113,311 102,301
Available seat miles (millions)(1) 104,427 47,337 147,995 156,793 151,679 139,505
Passenger mile yield(1) 13.88¢ 13.84¢ 13.34¢ 12.16¢ 12.17¢ 12.73¢
Passenger revenue per available seat mile(1) 11.30¢ 10.83¢ 10.47¢ 9.31¢ 9.09¢ 9.17¢
Operating cost per available seat mile(1) 12.03¢ 11.61¢ 11.80¢ 11.79¢ 12.23¢ 10.82¢
Passenger load factor(1) 81.4% 78.2% 78.5% 76.5% 74.7% 73.3%
Breakeven passenger load factor(1) 75.9% 73.7% 78.2% 87.0% 92.6% 77.8%
Fuel gallons consumed (millions) 1,458 659 2,111 2,492 2,527 2,370
Average price per fuel gallon, net of hedging gains $ 2.34 $ 1.93 $ 2.10 $ 1.79 $ 1.16 $ 0.82
Successor Predecessor
December 31,
2007(2)
December 31,
2006(4)(10) 2005(5)(10) 2004(6) 2003(7)
Total assets (millions)(1) $ 32,423 $ 19,622 $ 20,039 $ 21,801 $ 25,939
Long-term debt and capital leases (excluding current
maturities) (millions)(1) $ 7,986 $ 6,509 $ 6,557 $ 13,005 $ 11,538
Shareowners' equity (deficit) (millions)(1) $ 10,113 $ (13,593) $ (9,895) $ (5,796) $ (659)
Common stock outstanding 292,225,696 197,335,938 189,343,018 139,830,443 123,544,945
Full-time equivalent employees, end of period 55,044 51,322 55,650 69,148 70,600
(1) Includes the operations under contract carrier agreements with unaffiliated regional air carriers:
• SkyWest Airlines, Inc. and Chautauqua Airlines, Inc. for all periods presented;
• Shuttle America Corporation for the years ended December 31, 2007 and 2006 and from September 1 through December 31, 2005;
• Atlantic Southeast Airlines, Inc. for the years ended December 31, 2007 and 2006 and from September 8 through December 31, 2005;
• Freedom Airlines, Inc. for the years ended December 31, 2007 and 2006 and from October 1 through December 31, 2005;
• ExpressJet Airlines, Inc. from June 1 to December 31, 2007;
• Pinnacle Airlines, Inc. from December 1 to December 31, 2007; and
• Flyi, Inc. (formerly Atlantic Coast Airlines) from January 1, 2003 through November 1, 2004.
(2) Includes a $157 million or $0.40 diluted EPS for fresh start accounting adjustments; and a $211 million income tax provision or $0.53 diluted EPS (see Item 7).
24