Dell 2000 Annual Report Download - page 31
Download and view the complete annual report
Please find page 31 of the 2000 Dell annual report below. You can navigate through the pages in the report by either clicking on the pages listed below, or by using the keyword search tool below to find specific information within the annual report.-
 1
1 -
2
-
3
-
4
-
5
-
6
-
7
-
8
-
9
-
10
-
11
-
12
-
13
-
14
-
15
-
16
-
17
-
18
-
19
-
20
-
 21
21 -
 22
22 -
 23
23 -
 24
24 -
 25
25 -
 26
26 -
 27
27 -
 28
28 -
 29
29 -
 30
30 -
 31
31 -
 32
32 -
 33
33 -
 34
34 -
 35
35 -
 36
36 -
 37
37 -
 38
38 -
 39
39 -
 40
40 -
 41
41 -
42
-
43
-
44
-
45
-
46
-
47
-
48
-
49
-
50
-
51
-
52
-
53
-
54
-
55
-
56
-
57
-
58
-
59
-
60
-
61
-
62
-
63
-
64
 |
 |

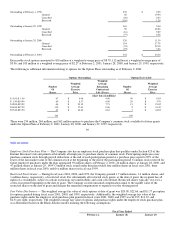
Outstanding at February 1, 1998 439 $ 2.25
Granted 60 19.94
Cancelled (26) 2.63
Exercised (110) 1.29
Outstanding at January 29, 1999 363 5.40
Granted 50 42.86
Cancelled (16) 9.89
Exercised (77) 2.48
Outstanding at January 28, 2000 320 11.39
Granted 154 37.78
Cancelled (35) 22.18
Exercised (95) 3.26
Outstanding at February 2, 2001 344 $ 24.36
Exercisable stock options amounted to 100 million at a weighted average price of $8.78, 112 million at a weighted average price of
$3.96, and 103 million at a weighted average price of $2.27 at February 2, 2001, January 28, 2000, and January 29, 1999, respectively.
The following is additional information relating to options for the Option Plans outstanding as of February 2, 2001:
Options Outstanding Options Exercisable
Weighted
Weighted Average Weighted
Number Average Remaining Number Average
Of Exercise Contractual Of Exercise
Shares Price Life (Years) Shares Price
(share data in millions)
$ 0.01-$ 1.49 67 $ 0.96 4.46 49 $ 0.95
$ 1.50-$14.99 60 $ 6.17 6.00 29 $ 5.79
$15.00-$35.99 44 $ 23.35 7.73 13 $ 21.02
$36.00-$37.59 112 $ 37.41 9.46 2 $ 33.39
$37.60-$53.90 61 $ 44.66 8.84 7 $ 44.82
344 100
There were 254 million, 264 million, and 162 million options to purchase the Company's common stock available for future grants
under the Option Plans at February 2, 2001, January 28, 2000, and January 29, 1999, respectively.
39
Table of Contents
Employee Stock Purchase Plan — The Company also has an employee stock purchase plan that qualifies under Section 423 of the
Internal Revenue Code and permits substantially all employees to purchase shares of common stock. Participating employees may
purchase common stock through payroll deductions at the end of each participation period at a purchase price equal to 85% of the
lower of the fair market value of the common stock at the beginning or the end of the participation period. Common stock reserved for
future employee purchases under the plan aggregated 39 million shares at February 2, 2001, 44 million shares at January 28, 2000, and
47 million shares at January 29, 1999. Common stock issued under this plan totaled four million shares in fiscal year 2001, three
million shares in fiscal year 2000, and five million shares in fiscal year 1999.
Restricted Stock Grants — During fiscal years 2001, 2000, and 1999, the Company granted 1.7 million shares, 1.4 million shares, and
1 million shares, respectively, of restricted stock. For substantially all restricted stock grants, at the date of grant, the recipient has all
rights of a stockholder, subject to certain restrictions on transferability and a risk of forfeiture. Restricted shares typically vest over a
seven-year period beginning on the date of grant. The Company records unearned compensation equal to the market value of the
restricted shares on the date of grant and charges the unearned compensation to expense over the vesting period.
Fair Value Disclosures — The weighted average fair value of stock options at date of grant was $20.98, $22.64, and $11.77 per option
for options granted during fiscal years 2001, 2000, and 1999, respectively. Additionally, the weighted average fair value of the
purchase rights under the employee stock purchase plan granted in fiscal years 2001, 2000, and 1999 was $13.95, $11.12, and
$2.51 per right, respectively. The weighted average fair value of options and purchase rights under the employee stock purchase plan
was determined based on the Black-Scholes model, utilizing the following assumptions:
Fiscal Year Ended
February 2, January 28, January 29,