Costco 2006 Annual Report Download - page 55
Download and view the complete annual report
Please find page 55 of the 2006 Costco annual report below. You can navigate through the pages in the report by either clicking on the pages listed below, or by using the keyword search tool below to find specific information within the annual report.-
 1
1 -
2
-
3
-
4
-
5
-
6
-
7
-
8
-
9
-
10
-
11
-
12
-
13
-
14
-
15
-
16
-
17
-
18
-
19
-
20
-
21
-
22
-
23
-
24
-
25
-
26
-
27
-
28
-
29
-
30
-
31
-
32
-
33
-
34
-
35
-
36
-
37
-
38
-
39
-
40
-
41
-
42
-
43
-
44
-
 45
45 -
 46
46 -
 47
47 -
 48
48 -
 49
49 -
 50
50 -
 51
51 -
 52
52 -
 53
53 -
 54
54 -
 55
55 -
 56
56 -
 57
57 -
 58
58 -
 59
59 -
 60
60 -
 61
61 -
 62
62 -
 63
63 -
 64
64 -
 65
65 -
66
-
67
-
68
-
69
-
70
-
71
-
72
-
73
-
74
-
75
-
76
 |
 |

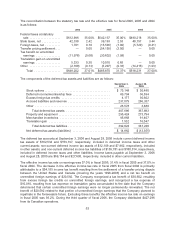
Fiscal 2005
Cost Basis Unrealized
Gains Unrealized
Losses Recorded
Basis
Available-for-sale securities
Money market mutual funds ............ $ 49,372 $ — $ — $ 49,372
U.S. government and agency securities . . 562,370 25 (4,630) 557,765
Corporate notes and bonds ............ 480,742 66 (2,289) 478,519
Asset and mortgage backed securities . . . 52,782 21 (431) 52,372
Total available-for-sale securities .... 1,145,266 112 (7,350) 1,138,028
Held-to-maturity
Certificates of deposit ................. 36,940 — — 36,940
Money market mutual funds ............ 6,779 — — 6,779
Corporate notes and bonds ............ 215,525 — — 215,525
Total held-to-maturity securities ..... 259,244 — — 259,244
Total short-term investments ........ $1,404,510 $112 $(7,350) $1,397,272
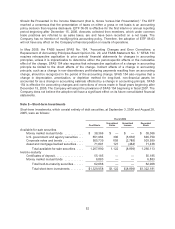
For available-for-sale securities, proceeds from sales were $263,288, $267,639, and $83,278 in fiscal
years 2006, 2005 and 2004, respectively. Gross realized gains from sales were $170, $90 and $128 in
fiscal years 2006, 2005 and 2004, respectively, and gross realized losses from sales were $1,252,
$825 and $167 in fiscal years 2006, 2005 and 2004, respectively.
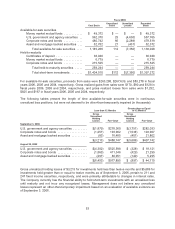
The following tables present the length of time available-for-sale securities were in continuous
unrealized loss positions, but were not deemed to be other-than-temporarily impaired (in thousands):
Less than 12 Months Greater than or Equal
to 12 Months
Gross
Unrealized
Holding
Losses Fair Value
Gross
Unrealized
Holding
Losses Fair Value
September 3, 2006
U.S. government and agency securities ......... $(1,879) $278,360 $(3,751) $282,033
Corporate notes and bonds ................... (1,251) 193,902 (1,534) 103,907
Asset and mortgage backed securities .......... (83) 16,485 (401) 21,802
$(3,213) $488,747 $(5,686) $407,742
August 28, 2005
U.S. government and agency securities ......... $(4,302) $525,598 $ (328) $ 18,121
Corporate notes and bonds ................... (1,860) 411,346 (429) 21,299
Asset and mortgage backed securities .......... (291) 40,951 (140) 5,295
$(6,453) $977,895 $ (897) $ 44,715
Gross unrealized holding losses of $3,213 for investments held less than twelve months and $5,686 for
investments held greater than or equal to twelve months as of September 3, 2006, pertain to 211 and
247 fixed income securities, respectively, and were primarily attributable to changes in interest rates.
The Company currently has the financial ability to hold short-term investments with an unrealized loss
until maturity and not incur any recognized losses. Management does not believe any unrealized
losses represent an other-than-temporary impairment based on an evaluation of available evidence as
of September 3, 2006.
53