ComEd 2005 Annual Report Download - page 33
Download and view the complete annual report
Please find page 33 of the 2005 ComEd annual report below. You can navigate through the pages in the report by either clicking on the pages listed below, or by using the keyword search tool below to find specific information within the annual report.-
 1
1 -
2
-
3
-
4
-
5
-
6
-
7
-
8
-
9
-
10
-
11
-
12
-
13
-
14
-
15
-
16
-
17
-
18
-
19
-
20
-
21
-
22
-
 23
23 -
 24
24 -
 25
25 -
 26
26 -
 27
27 -
 28
28 -
 29
29 -
 30
30 -
 31
31 -
 32
32 -
 33
33 -
 34
34 -
 35
35 -
 36
36 -
 37
37 -
 38
38 -
 39
39 -
 40
40 -
 41
41 -
 42
42
 |
 |

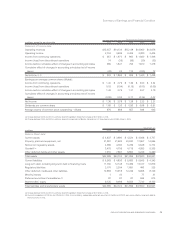
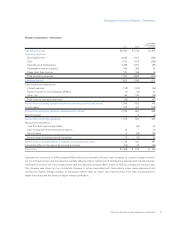
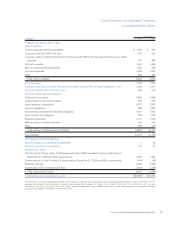
Discussion of Financial Results – Generation
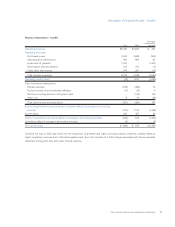
Results of Operations – Generation
2005 2004
Favorable
(unfavorable)
variance
Operating revenues $9,046 $7,703 $1,343
Operating expenses
Purchased power 2,569 2,307 (262)
Fuel 1,913 1,704 (209)
Operating and maintenance 2,288 2,201 (87)
Depreciation and amortization 254 286 32
Taxes other than income 170 166 (4)
Total operating expenses 7,194 6,664 (530)
Operating income 1,852 1,039 813
Other income and deductions
Interest expense (128) (103) (25)
Equity in losses of unconsolidated affiliates (1) (14) 13
Other, net 95 130 (35)
Total other income and deductions (34) 13 (47)
Income from continuing operations before income taxes and minority interest 1,818 1,052 766
Income taxes 709 401 (308)
Income from continuing operations before minority interest 1,109 651 458
Minority interest – 6 (6)
Income from continuing operations 1,109 657 452
Discontinued operations
Loss from discontinued operations – (45) 45
Gain on disposal of discontinued operations 24 – 24
Income taxes 5 (29) (34)
Income (loss) from discontinued operations 19 (16) 35
Income before cumulative effect of changes in accounting principles 1,128 641 487
Cumulative effect of changes in accounting principles (30) 32 (62)
Net income $1,098 $ 673 $ 425
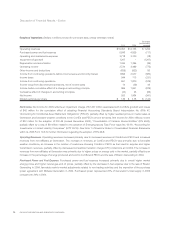
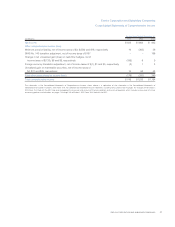
Generation’s net income in 2005 increased $425 million as compared to the prior year, primarily as a result of higher revenue,
net of purchased power and fuel expense, partially offset by higher operating and maintenance expense and interest expense.
Generation’s revenue, net of purchased power and fuel expense, increased $872 million in 2005 as compared to the prior year.
This increase was driven by the contractual increase in prices associated with Generation’s power sales agreement with
ComEd and higher average margins on wholesale market sales as higher spot market prices more than compensated for
higher fuel prices and the impact of higher nuclear generation.
EXELON CORPORATION AND SUBSIDIARY COMPANIES 31