ComEd 2005 Annual Report Download - page 27
Download and view the complete annual report
Please find page 27 of the 2005 ComEd annual report below. You can navigate through the pages in the report by either clicking on the pages listed below, or by using the keyword search tool below to find specific information within the annual report.-
 1
1 -
2
-
3
-
4
-
5
-
6
-
7
-
8
-
9
-
10
-
11
-
12
-
13
-
14
-
15
-
16
-
 17
17 -
 18
18 -
 19
19 -
 20
20 -
 21
21 -
 22
22 -
 23
23 -
 24
24 -
 25
25 -
 26
26 -
 27
27 -
 28
28 -
 29
29 -
 30
30 -
 31
31 -
 32
32 -
 33
33 -
 34
34 -
 35
35 -
 36
36 -
 37
37 -
38
-
39
-
40
-
41
-
42
 |
 |

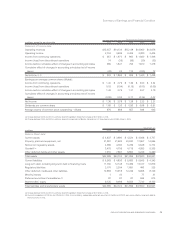
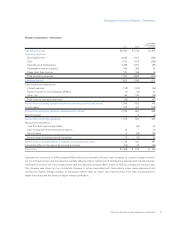
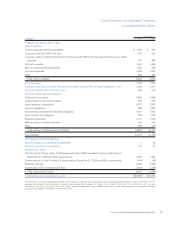
Summary of Earnings and Financial Condition
For the Years Ended December 31,
in millions, except for per share data 2005 2004 2003 2002 2001
Statement of Income data:
Operating revenues $15,357 $14,133 $15,148 $14,060 $13,978
Operating income 2,724 3,499 2,409 3,280 3,406
Income from continuing operations $ 951 $ 1,870 $ 892 $ 1,690 $ 1,448
Income (loss) from discontinued operations 14 (29) (99) (20) (32)
Income before cumulative effect of changes in accounting principles 965 1,841 793 1,670 1,416
Cumulative effect of changes in accounting principles (net of income
taxes) (42) 23 112 (230) 12
Net income (a), (b) $ 923 $ 1,864 $ 905 $ 1,440 $ 1,428
Earnings per average common share (diluted):
Income from continuing operations $ 1.40 $ 2.79 $ 1.36 $ 2.60 $ 2.24
Income (loss) from discontinued operations 0.02 (0.04) (0.15) (0.03) (0.05)
Income before cumulative effect of changes in accounting principles 1.42 2.75 1.21 2.57 2.19
Cumulative effect of changes in accounting principles (net of income
taxes) (0.06) 0.03 0.17 (0.35) 0.02
Net income $ 1.36 $ 2.78 $ 1.38 $ 2.22 $ 2.21
Dividends per common share $ 1.60 $ 1.26 $ 0.96 $ 0.88 $ 0.91
Average shares of common stock outstanding – diluted 676 669 657 649 645
(a) Change between 2005 and 2004 is primarily due to the goodwill impairment charge of $1.2 billion in 2005.
(b) Change between 2004 and 2003 is primarily due to the impairment of Boston Generating, LLC long-lived assets of $945 million in 2003.
December 31,
in millions 2005 2004 2003 2002 2001
Balance Sheet data:
Current assets $ 4,637 $ 3,880 $ 4,524 $ 4,096 $ 3,707
Property, plant and equipment, net 21,981 21,482 20,630 17,957 14,665
Noncurrent regulatory assets 4,386 4,790 5,226 5,546 5,774
Goodwill (a) 3,475 4,705 4,719 4,992 5,335
Other deferred debits and other assets 7,910 7,867 6,800 5,249 5,460
Total assets $42,389 $42,724 $41,899 $37,840 $34,941
Current liabilities $ 6,563 $ 4,836 $ 5,683 $ 5,845 $ 4,342
Long-term debt, including long-term debt to financing trusts 11,760 12,148 13,489 13,127 12,879
Regulatory liabilities 2,170 2,204 1,891 486 225
Other deferred credits and other liabilities 12,683 13,918 12,246 9,968 8,749
Minority interest 1 42 – 77 31
Preferred securities of subsidiaries (b) 87 87 87 595 613
Shareholders’ equity 9,125 9,489 8,503 7,742 8,102
Total liabilities and shareholders’ equity $42,389 $42,724 $41,899 $37,840 $34,941
(a) Change between 2005 and 2004 is primarily due to the goodwill impairment charge of $1.2 billion in 2005.
(b) Due to the adoptions of FIN 46 and FIN 46-R in 2003, the mandatorily redeemable preferred securities of ComEd and PECO were reclassified as long-term debt to
financing trusts in 2003.
EXELON CORPORATION AND SUBSIDIARY COMPANIES 25