ComEd 2004 Annual Report Download - page 27
Download and view the complete annual report
Please find page 27 of the 2004 ComEd annual report below. You can navigate through the pages in the report by either clicking on the pages listed below, or by using the keyword search tool below to find specific information within the annual report.-
 1
1 -
2
-
3
-
4
-
5
-
6
-
7
-
8
-
9
-
10
-
11
-
12
-
13
-
14
-
15
-
16
-
 17
17 -
 18
18 -
 19
19 -
 20
20 -
 21
21 -
 22
22 -
 23
23 -
 24
24 -
 25
25 -
 26
26 -
 27
27 -
 28
28 -
 29
29 -
 30
30 -
 31
31 -
 32
32 -
 33
33 -
 34
34 -
 35
35 -
 36
36 -
 37
37 -
38
-
39
-
40
-
41
-
42
 |
 |

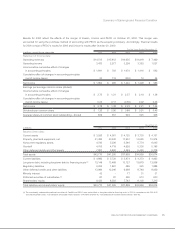
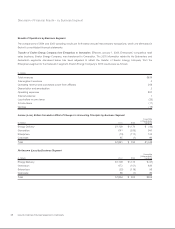
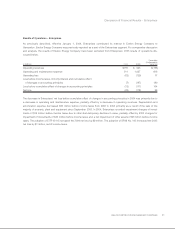
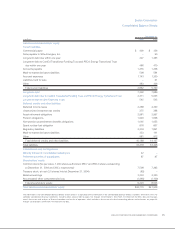
Summary of Earnings and Financial Condition
Results for 2000 reflect the effects of the merger of Exelon, Unicom and PECO on October 20, 2000. That merger was
accounted for using the purchase method of accounting with PECO as the acquiring company. Accordingly, financial results
for 2000 consist of PECO’s results for 2000 and Unicom’s results after October 20, 2000.
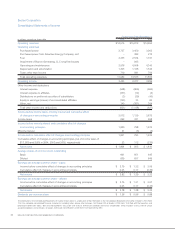
For the Years Ended December 31,
in millions, except for per share data 2004 2003 2002 2001 2000
Statement of Income data:
Operating revenues $14,515 $15,812 $14,955 $14,918 $ 7,499
Operating income 3,433 2,277 3,299 3,362 1,527
Income before cumulative effect of changes
in accounting principles $ 1,841 $ 793 $ 1,670 $ 1,416 $ 562
Cumulative effect of changes in accounting principles
(net of income taxes) 23 112 (230) 12 24
Net income $ 1,864 $ 905 $ 1,440 $ 1,428 $ 586
Earnings per average common share (diluted):
Income before cumulative effect of changes
in accounting principles $ 2.75 $ 1.21 $ 2.57 $ 2.19 $ 1.38
Cumulative effect of changes in accounting principles
(net of income taxes) 0.03 0.17 (0.35) 0.02 0.06
Net income $ 2.78 $ 1.38 $ 2.22 $ 2.21 $ 1.44
Dividends per common share $ 1.26 $ 0.96 $ 0.88 $ 0.91 $ 0.46
Average shares of common stock outstanding – diluted 669 657 649 645 408
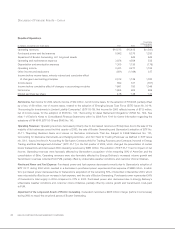
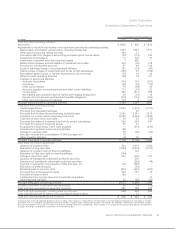
December 31,
in millions 2004 2003 2002 2001 2000
Balance Sheet data:
Current assets $ 3,926 $ 4,561 $ 4,125 $ 3,735 $ 4,151
Property, plant and equipment, net 21,482 20,630 17,957 14,665 15,914
Noncurrent regulatory assets 4,790 5,226 5,546 5,774 6,045
Goodwill 4,705 4,719 4,992 5,335 5,186
Other deferred debits and other assets 7,867 6,800 5,249 5,460 5,378
Total assets $42,770 $41,936 $37,869 $34,969 $36,674
Current liabilities $ 4,882 $ 5,720 $ 5,874 $ 4,370 $ 4,993
Long-term debt, including long-term debt to financing trusts (a) 12,148 13,489 13,127 12,879 12,958
Regulatory liabilities 2,204 1,891 486 225 1,888
Other deferred credits and other liabilities 13,984 12,246 9,968 8,749 8,959
Minority interest 42 – 77 31 31
Preferred securities of subsidiaries (a) 87 87 595 613 630
Shareholders’ equity 9,423 8,503 7,742 8,102 7,215
Total liabilities and shareholders’ equity $42,770 $41,936 $37,869 $34,969 $36,674
(a) The mandatorily redeemable preferred securities of ComEd and PECO were reclassified as long-term debt to financing trusts in 2003 in accordance with FIN 46-R
(revised December 2003), “Consolidation of Variable Interest Entities” (FIN 46-R) and FIN 46, “Consolidation of Variable Interest Entities” (FIN 46).
EXELON CORPORATION AND SUBSIDIARY COMPANIES 25