Cogeco 2009 Annual Report Download - page 11
Download and view the complete annual report
Please find page 11 of the 2009 Cogeco annual report below. You can navigate through the pages in the report by either clicking on the pages listed below, or by using the keyword search tool below to find specific information within the annual report.-
 1
1 -
 2
2 -
 3
3 -
 4
4 -
 5
5 -
 6
6 -
 7
7 -
 8
8 -
 9
9 -
 10
10 -
 11
11 -
 12
12 -
 13
13 -
 14
14 -
 15
15 -
 16
16 -
 17
17 -
 18
18 -
 19
19 -
 20
20 -
 21
21 -
 22
22 -
23
-
24
-
25
-
26
-
27
-
28
-
29
-
30
-
31
-
32
-
33
-
34
-
35
-
36
-
37
-
38
-
39
-
40
-
41
-
42
-
43
-
44
-
45
-
46
-
47
-
48
-
49
-
50
-
51
-
52
-
53
-
54
-
55
-
56
-
57
-
58
-
59
-
60
-
61
-
62
-
63
-
64
-
65
-
66
-
67
-
68
-
69
-
70
-
71
-
72
-
73
-
74
-
75
-
76
-
77
-
78
-
79
-
80
-
81
-
82
-
83
-
84
-
85
-
86
-
87
-
88
-
89
-
90
-
91
-
92
-
93
 |
 |

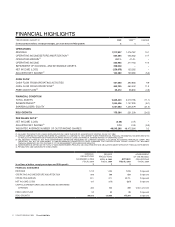
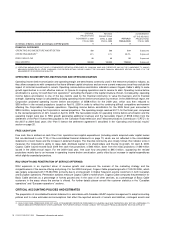
10 COGECO CABLE INC. 2009 Management’s discussion and analysis
(in millions of dollars, except percentages and RGU growth)
ORIGINAL
PROJECTIONS
NOVEMBER 3, 2008
FISCAL 2009
$
REVISED
PROJECTIONS
APRIL 8, 2009
FISCAL 2009
$
ACTUALS
FISCAL 2009
$
ACHIEVEMENT
OF THE REVISED
PROJECTIONS
FISCAL 2009
FINANCIAL GUIDELINES
OPERATING INCOME BEFORE AMORTIZATION
508 500 524 Surpassed
OPERATING MARGIN(1)
42% 42% 43.1% Surpassed
FREE CASH FLOW
90 80 95 Surpassed
RGU GROWTH
100,000 100,000 175,364 Surpassed
(1) OPERATING MARGIN DOES NOT HAVE A STANDARDIZED DEFINITION PRESCRIBED BY CANADIAN GAAP AND THEREFORE, MAY NOT BE COMPARABLE TO SIMILAR
MEASURES PRESENTED BY OTHER COMPANIES. FOR FURTHER DETAILS, PLEASE CONSULT THE “NON-GAAP FINANCIAL MEASURES” SECTION ON PAGE 37 OF THE
MANAGEMENT’S DISCUSSION AND ANALYSIS.
OPERATING INCOME BEFORE AMORTIZATION AND OPERATING MARGIN
Operating income before amortization and operating margin are benchmarks commonly used in the telecommunications industry, as
they allow comparisons with companies that have different capital structures and are more current measures since they exclude the
impact of historical investments in assets. Operating income before amortization indicators assess Cogeco Cable’s ability to seize
growth opportunities in a cost effective manner, to finance its ongoing operations and to service its debt. Operating income before
amortization is a proxy for cash flow from operations
(1)
excluding the impact of the capital structure chosen. Consequently, operating
income before amortization is one of the key metrics used by the financial community to value the business and its financial
strength. Operating margin is calculated by dividing operating income before amortization by revenue. In the 2008 Annual report, the
Corporation projected operating income before amortization of $508 million for the 2009 year, which was then reduced to
$500 million in the revised projections issued on April 8, 2009 in order to reflect the continuing difficult competitive environment
affecting the Corporation’s European operations. Operating income before amortization for the 2009 fiscal year amounted to
$524.4 million, surpassing the Corporation’s revised projections. The operating margin reached 43.1% for the fiscal year, compared
to the revised projections of 42% issued on April 8, 2009. The favourable results for operating income before amortization and the
operating margin were due to RGU growth generating additional revenues and the favourable impact of $19.8 million from the
settlement of the Part II licence fees payable to the Canadian Radio-television and Telecommunications Commission (“CRTC”) for
the 2007 to 2009 fiscal years (the “Part II licence fee settlement agreement”) described in the “Operating and financial results”
section on page 25.
FREE CASH FLOW
Free cash flow is defined as cash flows from operations less capital expenditures (including assets acquired under capital leases
that are disclosed in note 17 B) of the consolidated financial statements on page 73, which are not reflected in the consolidated
statements of cash flows) and the increase in deferred charges. The financial community also closely follows this indicator since it
measures the Corporation’s ability to repay debt, distribute capital to its shareholders and finance its growth. On April 8, 2009,
Cogeco Cable issued revised fiscal 2009 free cash flow projections of $80 million, down from the initial projections of $90 million
issued in the 2008 annual report. For the 2009 fiscal year, free cash flow amounted to $95.4 million, surpassing the revised
projections mainly due to an increase in operating income before amortization, partly offset by an increase in capital expenditures
which slightly exceeded projections.
RGU GROWTH AND PENETRATION OF SERVICE OFFERINGS
RGU expansion is an important driver of revenue growth and measures the success of the marketing strategy and the
competitiveness of the service offering and pricing. For the 2009 fiscal year, Cogeco Cable projected growth of 100,000 RGU, which
was largely surpassed with 175,364 RGU primarily due to strong growth in Digital Television service customers in both Canadian
and European operations. Penetration statistics measure Cogeco Cable’s market share. Cogeco Cable computes the penetration for
Basic Cable services as a percentage of homes passed and, in the case of all other services, as a percentage of Basic Cable
customers in the areas where the service is offered. For further details please consult the customer statistics in the “Canadian
operations” and “European operations” sections.
CRITICAL ACCOUNTING POLICIES AND ESTIMATES
The preparation of consolidated financial statements in accordance with Canadian GAAP requires management to adopt accounting
policies and to make estimates and assumptions that affect the reported amounts of assets and liabilities, contingent assets and
(1) CASH FLOW FROM OPERATIONS DOES NOT HAVE A STANDARDIZED DEFINITION PRESCRIBED BY CANADIAN GAAP AND THEREFORE, MAY NOT BE COMPARABLE TO
SIMILAR MEASURES PRESENTED BY OTHER COMPANIES. FOR FURTHER DETAILS, PLEASE CONSULT THE “NON-GAAP FINANCIAL MEASURES” SECTION ON PAGE 37.