Circuit City 2001 Annual Report Download - page 13
Download and view the complete annual report
Please find page 13 of the 2001 Circuit City annual report below. You can navigate through the pages in the report by either clicking on the pages listed below, or by using the keyword search tool below to find specific information within the annual report.-
 1
1 -
2
-
 3
3 -
 4
4 -
 5
5 -
 6
6 -
 7
7 -
 8
8 -
 9
9 -
 10
10 -
 11
11 -
 12
12 -
 13
13 -
 14
14 -
 15
15 -
 16
16 -
 17
17 -
 18
18 -
 19
19 -
 20
20 -
 21
21 -
 22
22 -
 23
23 -
24
-
25
-
26
-
27
-
28
-
29
-
30
-
31
-
32
-
33
-
34
-
35
-
36
-
37
-
38
-
39
-
40
-
41
 |
 |
related to sales of its PCs. The Company incurred consulting costs associated with implementation of a new e-commerce internet platform and
new order entry and fulfillment software. The Company also wrote off approximately $2 million of previously capitalized software projects
abandoned in 2001. These costs were partially offset by decreases in catalog advertising costs, staff reductions and lower bad debt expense.
For the year ended December 31, 2000, selling, general and administrative expenses totaled $270.9 million, or 16.1% of net sales, compared to
$254.7 million, or 14.5% of net sales in 1999. This increase resulted from higher personnel and related costs in both North America and
Europe, reflecting the increase in the worldwide relationship marketing sales force and higher bad debt expense. These expense increases were
partially offset by lower advertising costs associated with catalog mailings as the Company's focus continues to shift to relationship sales and
decreases in staffing levels in areas other than relationship marketing during the year to adjust to the lower level of incoming business.
INCOME (LOSS) FROM OPERATIONS
The Company reported income from operations of $2.5 million in 2001, had a loss from operations for the year ended December 31, 2000 of
$61.0 million and income from operations of $59.8 million for the year ended December 31, 1999. Income from operations in 2001 includes
the elimination of a liability of $3 million recorded in a prior year which the Company determined is no longer required. The operating loss in
2000 resulted from the decline in gross profit and increase in selling, general and administrative expenses as discussed above. During the
second quarter of 2000, the Company sold its internet auction subsidiary, EZBid Inc., and closed a small software sales subsidiary, which
together eliminated approximately $5 million in operating losses on an annualized basis. Operating income in Europe increased to $18.2
million in 2001, from $17.3 million in 2000 and $10.5 million in 1999. European results were adversely affected by $0.6 million in 2001
compared to 2000 and $1.5 million in 2000 compared to 1999, due to the stronger dollar in relation to European currencies.
INTEREST AND OTHER INCOME/INTEREST EXPENSE
Interest expense decreased to $1.8 million in 2001 from $4.4 million in 2000 due to decreased borrowings under the Company's credit facilities
and lower short-term interest rates. The weighted average interest rate on short-term borrowings was 6.6% in 2001 and 7.9% in 2000. Interest
and other income was $0.3 million in 2001, $0.1 million in 2000 and $1.2 million in 1999.
INCOME TAXES
The effective tax rate in 2001 was 37.3%. Income taxes in 2000 consist of income tax benefits for net operating loss carrybacks, reduced by
foreign income taxes paid or payable. The effective tax rate was 40.5% in 1999 as a result of higher state and local taxes in the United States
and a change in the relative income earned in foreign locations. No tax benefit has been recorded for certain state and local and foreign net
operating loss carryforwards, where the realizability of the related deferred tax benefits cannot be reasonably assured.
NET INCOME (LOSS)
As a result of the above, net income for 2001 was $653,000, or $.02 per basic and diluted share, the net loss for 2000 was $40.8 million, or
$1.19 per basic and diluted share, and net income for 1999 was $36.0 million, or $1.01 per basic and diluted share.
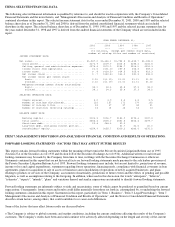
SEASONALITY
Net sales have historically been modestly weaker during the second and third quarter as a result of lower business activity during the summer
months. The following table sets forth the net sales, gross profit and income (loss) from operations for each of the quarters since January 1,
2000 (AMOUNTS IN MILLIONS).
FINANCIAL CONDITION, LIQUIDITY AND CAPITAL RESOURCES
Liquidity is the ability to generate sufficient cash flows from operating activities to meet obligations and commitments. In addition, liquidity
includes the ability to obtain appropriate financing and to convert those assets that are no longer required to meet existing strategic and
financing objectives into cash. Therefore, liquidity cannot be considered separately from capital resources that consist of current and potentially
available funds for use in achieving long-range business objectives and meeting debt service commitments. Currently, the Company's liquidity
needs arise primarily from working capital requirements and capital expenditures.
2001 MARCH 31 JUNE 30 SEPTEMBER 30 DECEMBER 31
---- -------- ------- ------------ -----------
NET SALES...................... $406 $364 $371 $407
GROSS PROFIT................... $66 $61 $69 $80
INCOME (LOSS) FROM OPERATIONS.. $1 $(3) $1 $4
2000 MARCH 31 JUNE 30 SEPTEMBER 30 DECEMBER 31
---- -------- ------- ------------ -----------
Net sales...................... $449 $406 $410 $421
Gross profit................... $68 $44 $48 $50
Loss from operations........... $(3) $(20) $(21) $(17)