Circuit City 1997 Annual Report Download - page 12
Download and view the complete annual report
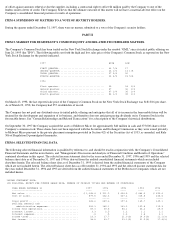
Please find page 12 of the 1997 Circuit City annual report below. You can navigate through the pages in the report by either clicking on the pages listed below, or by using the keyword search tool below to find specific information within the annual report.-
 1
1 -
 2
2 -
 3
3 -
 4
4 -
 5
5 -
 6
6 -
 7
7 -
 8
8 -
 9
9 -
 10
10 -
 11
11 -
 12
12 -
 13
13 -
 14
14 -
 15
15 -
 16
16 -
 17
17 -
 18
18 -
 19
19 -
 20
20 -
 21
21 -
 22
22 -
23
-
24
-
25
-
26
-
27
-
28
-
29
-
30
-
31
-
32
-
33
-
34
-
35
-
36
-
37
-
38
-
39
-
40
-
41
-
42
-
43
-
44
-
45
-
46
-
47
-
48
-
49
-
50
-
51
-
52
-
53
 |
 |
average order sizes, vendor supported advertising, continued expense control and the leveraging of selling, general and administrative expenses
over a larger sales base. Included in selling, general and administrative expenses in 1997 was a one time charge of $9.6 million incurred during
the third quarter relating to the impairment of certain long lived assets, principally goodwill.
As a result of the above, income from operations decreased by $10.2 million or 14.7% to $59.3 million in 1997 from $69.5 million in 1996.
Income from operations as a percentage of net sales decreased to 5.2% from 7.6% in 1996.
Interest income increased $ .8 million to $3.3 million in 1997 from $2.5 million in 1996 primarily due to higher levels of investments in short-
term securities. Interest expense decreased $ .1 million to $ .4 million in 1997 from $ .5 million in 1996.
Net income decreased $4.9 million or 11.2% to $38.8 million in 1997 principally as a result of the above.
YEAR ENDED DECEMBER 31, 1996 COMPARED TO YEAR ENDED DECEMBER 31, 1995
Net sales increased by $277.4 million or 43.7% to $911.9 million in 1996 from $634.5 million in 1995. The increase was primarily attributable
to (i) internal growth fueled by an increase in the number of catalogs mailed (including eight new catalog titles), an increase in revenue from
the Company's major account sales program and an increased average order value resulting from increased offerings and sales of brand name
products and (ii) the inclusion of a full year of sales from TigerDirect verses one month in 1995. Sales attributable to the Company's North
American operations increased 52.1% to $677.8 million in 1996 from $445.7 in 1995 as compared with a 24.0% increase in European sales to
$234.1 million in 1996 from $188.8 million in 1995.
Gross profit, which consists of net sales less product, shipping and certain distribution center costs, increased by $52.3 million or 26.5% to
$249.6 million in 1996 from $197.3 million in 1995. Gross profit margin decreased to 27.4% in 1996 from 31.1% in 1995. The decrease in
gross profit margin was due in part to the inclusion of a full year of sales from TigerDirect whose product mix has a lower gross profit margin,
and the Company's strategic decision to increase the proportion of net sales attributable to brand name products, particularly computer related
products and hardware which typically have lower gross profit margins than many of the Company's other products.
A significant portion of this decline in gross profit margin has been offset by the continued decline in selling, general and administrative
expenses as a percentage of net sales. While selling, general and administrative expenses increased by $37.1 million or 25.9% to $180.1 million
in 1996 from $143.0 million in 1995, as a percentage of net sales they decreased to 19.8% in 1996 from 22.5% in 1995. The decrease as a
percentage of net sales was primarily attributable to reduced catalog costs in North America as a result of the increased vendor supported
advertising, continued expense control and the leveraging of selling, general and administrative expenses over a larger sales base. As a result of
expenses associated with the Company's launching of cross border catalogs in the first quarter in Europe, selling, general and administrative
expenses as a percentage of net sales for Europe did not decrease significantly. These European cross border catalogs were mailed into
countries where the Company did not have an existing customer base and accordingly yielded lower catalog response rates than the Company's
other catalogs.
Income from operations increased by $15.2 million or 28.0% to $69.5 million in 1996 from $54.3 million in 1995. Income from operations as a
percentage of net sales decreased to 7.6% from 8.6% in 1995 as a result of a $4.6 million decrease in operating profits for Europe and the
inclusion of a full year of Tiger which had a lower operating profit margin than the rest of North America.
Interest income increased $1.3 million to $2.5 million in 1996 from $1.2 million in 1995 primarily due to investment in short-term securities.
Interest expense decreased $1.9 million to $ .5 million in 1996 from $2.4 million in 1995 primarily as a result of the repayments of officers'
notes issued during 1995.
Net income increased $8.0 million or 22.4% to $43.7 million in 1996 as a result of the increase in income from operations described above and
a $4.7 million decrease in Officers Compensation and an increase of $15.0 million in income taxes as a result of the predecessor companies
termination of S Corporation status. Net income increased $10.6 million or 32.0% compared to 1995 pro forma net income of $33.1 million, as
described below.
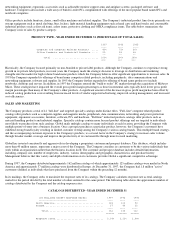
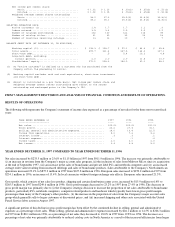
SEASONALITY
The operations of the Company are somewhat seasonal. In particular, net sales have historically been modestly weaker during the second and
third quarter as a result of lower business activity during the summer months. The following table sets forth net sales, gross profit and income
from operations for each of the quarters since January 1, 1996 (AMOUNTS IN MILLIONS).
1997 MARCH 31 JUNE 30 SEPTEMBER 30 DECEMBER 31
---- -------- ------- ------------ -----------
NET SALES...................................... $273.5 $259.5 $259.7 $352.7 (1)
GROSS PROFIT................................... 69.4 64.2 57.3 74.7
INCOME FROM OPERATIONS......................... 18.6 17.9 2.5 20.3
1996 MARCH 31 JUNE 30 SEPTEMBER 30 DECEMBER 31
---- -------- ------- ------------ -----------