Circuit City 1997 Annual Report Download - page 11
Download and view the complete annual report
Please find page 11 of the 1997 Circuit City annual report below. You can navigate through the pages in the report by either clicking on the pages listed below, or by using the keyword search tool below to find specific information within the annual report.-
 1
1 -
 2
2 -
 3
3 -
 4
4 -
 5
5 -
 6
6 -
 7
7 -
 8
8 -
 9
9 -
 10
10 -
 11
11 -
 12
12 -
 13
13 -
 14
14 -
 15
15 -
 16
16 -
 17
17 -
 18
18 -
 19
19 -
 20
20 -
 21
21 -
 22
22 -
23
-
24
-
25
-
26
-
27
-
28
-
29
-
30
-
31
-
32
-
33
-
34
-
35
-
36
-
37
-
38
-
39
-
40
-
41
-
42
-
43
-
44
-
45
-
46
-
47
-
48
-
49
-
50
-
51
-
52
-
53
 |
 |
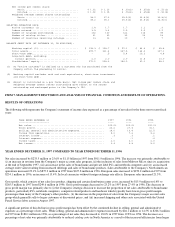
ITEM 7. MANAGEMENT'S DISCUSSION AND ANALYSIS OF FINANCIAL CONDITION AND RESULTS OF OPERATIONS.
RESULTS OF OPERATIONS
The following table represents the Company's statement of income data expressed as a percentage of net sales for the three most recent fiscal
years:
YEAR ENDED DECEMBER 31, 1997 COMPARED TO YEAR ENDED DECEMBER 31, 1996
Net sales increased by $233.5 million or 25.6% to $1.15 billion in 1997 from $911.9 million in 1996. The increase was primarily attributable to
(i) an increase in revenue from the Company's major account sales program, (ii) the inclusion of sales from Midwest Micro since its acquisition
at the end of September 1997, (iii) an increase in the sales of brand name and private label PCs and notebook computers and (iv) an increased
average order value resulting from increased offerings and sales of brand name products. Sales attributable to the Company's North American
operations increased 29.1% to $875.2 million in 1997 from $677.8 million in 1996. European sales increased to $270.2 million in 1997 from
$234.1 million in 1996, an increase of 15.4%. In local currencies without foreign exchange rate effects, European sales increased 21.3%.
Gross profit, which consists of net sales less product, shipping and certain distribution center costs, increased by $15.9 million or 6.4% to
$265.5 million in 1997 from $249.6 million in 1996. Gross profit margin decreased to 23.2% in 1997 from 27.4% in 1996. The decrease in
gross profit margin was primarily due to (i) the Company's strategic decision to increase the proportion of net sales attributable to brand name
products, particularly PCs, notebook computers, computer related products and hardware which typically have lower gross profit margin
percentages than many of the Company's other products, (ii) the increase in the proportion of sales from the Company's major account sales
group which generally sells to larger customers at discounted prices, and (iii) increased shipping and other costs associated with the United
Parcel Service labor action in August 1997.
A significant portion of this decline in gross profit margin has been offset by the continued decline in selling, general and administrative
expenses as a percentage of net sales. While selling, general and administrative expenses increased by $26.1 million or 14.5% to $206.3 million
in 1997 from $180.1 million in 1996, as a percentage of net sales they decreased to 18.0% in 1997 from 19.8% in 1996. The decrease as a
percentage of net sales was primarily attributable to reduced catalog costs in North America as a result of the increased efficiencies from larger
Net income per common share:
Basic....................................... $ 1.02 $ 1.16 $ .93(3) $ .65(3) $ .51(3)
Diluted..................................... $ 1.02 $ 1.15 $ .93(3) $ .65(3) $ .51(3)
Weighted average common shares outstanding
Basic....................................... 38.0 37.6 35.5(3) 33.8(3) 33.8(3)
Diluted..................................... 38.2 38.1 35.5(3) 33.8(3) 33.8(3)
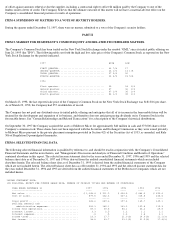
SELECTED OPERATING DATA:
Active customers (1)............................ 1.8 1.7 1.7 1.1 .9
Orders entered.................................. 3.5 3.4 2.5 2.2 1.9
Number of catalogs distributed.................. 162 160 122 114 98
Number of catalog titles........................ 41 40 32 24 18
Number of countries receiving catalogs.......... 13 12 10 7 7
BALANCE SHEET DATA (AT DECEMBER 31, IN MILLIONS):
Working capital (2)............................. $ 135.3 $ 128.7 $ 99.1 $ 84.6 $ 65.8
Total assets.................................... 399.7 331.4 247.5 164.2 127.1
Short-term debt................................. - .5 5.4 19.2 4.8
Long-term debt, excluding
current portion............................... 2.0 2.0 2.9 11.5 13.9
Stockholders' equity............................ 272.2 228.6 154.0 69.1 58.1
(1) An "active customer" is defined as a customer who has purchased from the
Company within the preceding 12 months.
(2) Working capital excludes cash and cash equivalents, short-term investments
and short-term debt.
(3) Amount is calculated on a pro forma basis. Net income per common share and
weighted average common shares outstanding give effect to the shares
outstanding and exchanged prior to the Company's IPO.
YEAR ENDED DECEMBER 31 1997 1996 1995
---------------------- ---- ---- ----
Net sales..................................................... 100.0% 100.0% 100.0%
Gross profit.................................................. 23.2 27.4 31.1
Selling, general and administrative expenses.................. 18.0 19.8 22.5
Income from operations........................................ 5.2 7.6 8.6
Interest income............................................... .3 .3 .2
Interest expense.............................................. - .1 .4
Income taxes.................................................. 2.0 3.0 2.0
Net income.................................................... 3.4 4.8 5.6