Chevron 2003 Annual Report Download - page 7
Download and view the complete annual report
Please find page 7 of the 2003 Chevron annual report below. You can navigate through the pages in the report by either clicking on the pages listed below, or by using the keyword search tool below to find specific information within the annual report.-
 1
1 -
 2
2 -
 3
3 -
 4
4 -
 5
5 -
 6
6 -
 7
7 -
 8
8 -
 9
9 -
 10
10 -
 11
11 -
 12
12 -
 13
13 -
 14
14 -
 15
15 -
 16
16 -
 17
17 -
 18
18 -
19
-
20
-
21
-
22
-
23
-
24
-
25
-
26
-
27
-
28
-
29
-
30
-
31
-
32
-
33
-
34
-
35
-
36
-
37
-
38
-
39
-
40
-
41
-
42
-
43
-
44
-
45
-
46
-
47
-
48
-
49
-
50
-
51
-
52
-
53
-
54
-
55
-
56
-
57
-
58
-
59
-
60
-
61
-
62
-
63
-
64
-
65
-
66
-
67
-
68
-
69
-
70
-
71
-
72
-
73
-
74
-
75
-
76
-
77
-
78
-
79
-
80
-
81
-
82
-
83
-
84
-
85
-
86
-
87
-
88
-
89
-
90
 |
 |

5
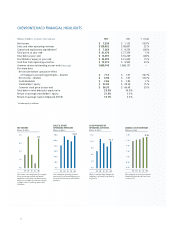
CHEVRONTEXACO OPERATING HIGHLIGHTS1
2003 2002 % Change
Net production of crude oil and natural gas liquids (Thousands of barrels per day) 1,808 1,897 (5)%
Net production of natural gas (Millions of cubic feet per day) 4,292 4,376 (2)%
Net oil-equivalent production (Thousands of oil-equivalent barrels per day) 2,523 2,626 (4)%
Refi nery input (Thousands of barrels per day) 1,991 2,079 (4)%
Sales of refi ned products (Thousands of barrels per day) 3,738 3,775 (1)%
Net proved reserves of crude oil, condensate and natural gas liquids2(Millions of barrels) 8,599 8,668 (1)%
Net proved reserves of natural gas2 (Billions of cubic feet) 20,191 19,335 4 %
Net proved oil-equivalent reserves2(Millions of barrels) 11,964 11,890 1 %
Number of employees at year-end3 50,582 53,014 (5)%
1 Includes equity in affi liates, except number of employees
2 At the end of the year
3 Excludes service station personnel
0.0
12.0
10. 0
8.0
6.0
4.0
2.0
0099 01 02 03
$7.4
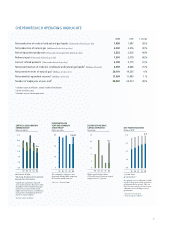
CAPITAL & EXPLORATORY
EXPENDITURES*
Billions of dollars
Capital and exploratory expendi-
tures declined about 20 percent from
the 2002 level that included the acqui-
sition of assets previously leased,
higher investments in a Canadian oil
sands project and additional invest-
ments in equity affiliates.
*Includes equity in affiliates
Chemicals & Other
Refining, Marketing & Transportation
Exploration & Production
0
90
60
30
0099 01 02 03
$86.39
CHEVRONTEXACO
YEAR-END COMMON
STOCK PRICE*
Dollars per share
The company’s stock price rose
30 percent during 2003, outpacing
the broader market indexes.
*Chevron – 1999 and 2000
0
20
16
12
8
4
0099 01 02 03
15.7
RETURN ON AVERAGE
CAPITAL EMPLOYED
Percentage
Higher profits helped boost
ChevronTexaco’s return on capital
employed to 15.7 percent.
0.0
12.0
6.0
9.0
3.0
0099 01 02 03
12.0
Net proved reserves additions in 2003
equaled 108 percent of oil-equivalent
production for the period. This was
the 11th consecutive year that reserve
additions exceeded 100 percent of
production.
*Barrels of oil-equivalent
**Includes equity in affiliates
NET PROVED RESERVES
Billions of BOE*
United States
International**