Chevron 2003 Annual Report Download - page 6
Download and view the complete annual report
Please find page 6 of the 2003 Chevron annual report below. You can navigate through the pages in the report by either clicking on the pages listed below, or by using the keyword search tool below to find specific information within the annual report.-
 1
1 -
 2
2 -
 3
3 -
 4
4 -
 5
5 -
 6
6 -
 7
7 -
 8
8 -
 9
9 -
 10
10 -
 11
11 -
 12
12 -
 13
13 -
 14
14 -
 15
15 -
 16
16 -
 17
17 -
18
-
19
-
20
-
21
-
22
-
23
-
24
-
25
-
26
-
27
-
28
-
29
-
30
-
31
-
32
-
33
-
34
-
35
-
36
-
37
-
38
-
39
-
40
-
41
-
42
-
43
-
44
-
45
-
46
-
47
-
48
-
49
-
50
-
51
-
52
-
53
-
54
-
55
-
56
-
57
-
58
-
59
-
60
-
61
-
62
-
63
-
64
-
65
-
66
-
67
-
68
-
69
-
70
-
71
-
72
-
73
-
74
-
75
-
76
-
77
-
78
-
79
-
80
-
81
-
82
-
83
-
84
-
85
-
86
-
87
-
88
-
89
-
90
 |
 |

4
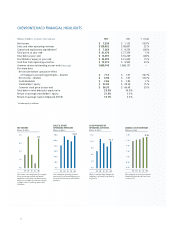
CHEVRONTEXACO FINANCIAL HIGHLIGHTS
Millions of dollars, except per-share amounts 2003 2002 % Change
Net income $ 7,230 $ 1,132 539 %
Sales and other operating revenues $ 120,032 $ 98,691 22 %
Capital and exploratory expenditures* $ 7,363 $ 9,255 (20)%
Total assets at year-end $ 81,470 $ 77,359 5 %
Total debt at year-end $ 12,597 $ 16,269 (23)%
Stockholders’ equity at year-end $ 36,295 $ 31,604 15 %
Cash fl ow from operating activities $ 12,315 $ 9,943 24 %
Common shares outstanding at year-end (Thousands) 1,069,148 1,068,137 –
Per-share data
Net income before cumulative effect
of changes in accounting principles – diluted $ 7.14 $ 1.07 567 %
Net income – diluted $ 6.96 $ 1.07 550 %
Cash dividends $ 2.86 $ 2.80 2 %
Stockholders’ equity $ 33.95 $ 29.59 15 %
Common stock price at year-end $ 86.39 $ 66.48 30 %
Total debt to total debt-plus-equity ratio 25.8% 34.0%
Return on average stockholders’ equity 21.3% 3.5%
Return on average capital employed (ROCE) 15.7% 3.2%
* Includes equity in affi liates
0.0
8.0
6.0
4.0
2.0
0099 01 02 03
$7.2
NET INCOME
Billions of dollars
Net income rose sharply on the strength
of upstream operations and much-
improved results from the downstream
businesses in 2003. Special-item charges
in 2002 reduced earnings more than
$3 billion.
0.0
120.0
100 .0
80.0
60.0
40.0
20.0
0099 01 02 03
$120.0
SALES & OTHER
OPERATING REVENUES
Billions of dollars
Sales and other operating revenues
increased 22 percent on higher prices
for crude oil, natural gas and refined
products.
0.0
15.0
12.0
9.0
6.0
3.0
0099 01 02 03
$12.3
CASH PROVIDED BY
OPERATING ACTIVITIES
Billions of dollars
Higher earnings helped boost the
company’s operating cash flow by
24 percent.
0.00
3.00
2.50
2.00
1.50
1.00
0.50
0099 01 02 03
$2.86
ANNUAL CASH DIVIDENDS
Dollars per share
The company increased its annual
dividend payout for the 16th con-
secutive year.