Chesapeake Energy 1999 Annual Report Download - page 5
Download and view the complete annual report
Please find page 5 of the 1999 Chesapeake Energy annual report below. You can navigate through the pages in the report by either clicking on the pages listed below, or by using the keyword search tool below to find specific information within the annual report.
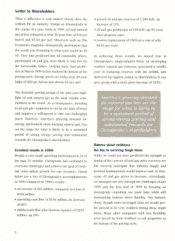
We built Chesapeake's balance sheet to withstand
the downturns that periodically occur in our
industry. Other than a small working capital facil-
ity, none of Chesapeake's debt is owed to banks.
Instead, our capital providers have been high-yield
mutual funds and insurance companies that do not
require repayment for years to come (2004 is our
earliest maturity, 2012 the latest). With their
understanding of the ups and downs of the energy
industry, these capital providers do not require
collateral or other rigid lending provisions
imposed by traditional lenders. This flexibility
enabled us to carry on through last year's turbu-
lent cycle so our shareholders could enjoy this
year's resurgent oil and gas prices.
Chesapeake's low costs lead the industry
In addition to a resilient balance sheet and a
strategically focused emphasis on natural gas, we
also enjoy an industry-leading cost structure. This
attractive cost structure reflects the high quality of
our properties and the strong work ethic of our
employees and hence, our motto Energy At Work.
As a young company in a rapidly aging industry
(50% of the industry's technical talent will reach
retirement age in the next 12 years), we believe we
can stay a step ahead of the competition. And with
all of Chesapeake's employees owning stock (man-
agement and directors together own 25% of the
total shares), we are motivated to work especially
hard to create shareholder value.
In addition, our wells' average productivity is 50%
higher than the industry's average and their close
proximity to a well-developed service infrastruc-
ture provides for lower current and future main-
tenance costs.
Growth capital used to build Chesapeake's
premier natural gas franchise
The debt we incurred and assets we acquired during
the past 10 years have enabled us to build
Chesapeake into one of the largest natural gas fran-
chises in the U.S. The providers of Chesapeake's
growth capital (ultimately the individual investors in
the mutual funds, 401-K plans, and insurance poli-
cies who invest in high yield debt) entrusted their
investment to us for extended periods so that we
would have time to execute our strategy and create
value for investors.
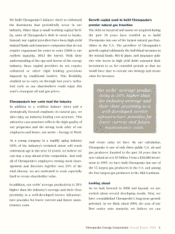
Our wells' average produc-
tivity is 50% higher than
the industry average and
their close proximity to a
well-developed service
infrastructure provides for
lower current and future
maintenance costs.
And create value we have. By our calculation,
Chesapeake is one of only three public U.S. oil and
gas producers founded in the past 10 years that is
now valued at over $1 billion. From a $50,000 invest-
ment in 1989, we have built Chesapeake into one of
the 15 largest gas producers in the U.S. and among
the four largest gas producers in the Mid-Continent.
Looking ahead
As we look forward to 2000 and beyond, we are
excited about several developing trends. First, we
have reestablished Chesapeake's long-term growth
potential. As we think about 2004, the year of our
first senior note maturity, we believe we can
Chesapeake Energy Corporation Annual Report 1999 3

