Chesapeake Energy 1999 Annual Report Download - page 3
Download and view the complete annual report
Please find page 3 of the 1999 Chesapeake Energy annual report below. You can navigate through the pages in the report by either clicking on the pages listed below, or by using the keyword search tool below to find specific information within the annual report.-
 1
1 -
 2
2 -
 3
3 -
 4
4 -
 5
5 -
 6
6 -
 7
7 -
 8
8 -
 9
9 -
 10
10 -
 11
11 -
 12
12 -
 13
13 -
 14
14 -
15
-
16
-
17
-
18
-
19
-
20
-
21
-
22
-
23
-
24
-
25
-
26
-
27
-
28
-
29
-
30
-
31
-
32
-
33
-
34
-
35
-
36
-
37
-
38
-
39
-
40
-
41
-
42
-
43
-
44
-
45
-
46
-
47
-
48
-
49
-
50
-
51
-
52
-
53
-
54
-
55
-
56
-
57
-
58
-
59
-
60
-
61
-
62
-
63
-
64
-
65
-
66
-
67
-
68
-
69
-
70
-
71
-
72
-
73
-
74
-
75
-
76
-
77
-
78
-
79
-
80
-
81
-
82
-
83
-
84
-
85
-
86
-
87
 |
 |

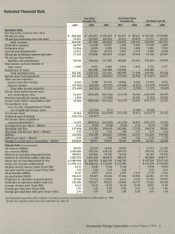
Selected Financial Data
*An independent appraisal of the company's oil and gas reserves was not performed as ofDecember 31, 1996,
because the company 'sfiscal year-end at that time was June 30.
Chesapeake Energy Corporation Annual Report 1999 1
Year Ended
December 31,
Six Months Ended
December 31, Year Ended June 30,
1999 1998 1997 1997 1996 1997 1996
Operations Data
($ in thousands, except per share data)
Oil and gas sales $280,445 $256,887 $ 198,410 $ 95,657 $ 90,167 $ 192,920 $110,849
Oil and gas marketing sales and other 74,501 121,059 104,394 58,241 30,019 76,172 34,742
Total revenues 354,946 377,946 302,804 153,898 120,186 269,092 145,591
Production expenses 46,298 51.202 14,737 7,560 4.268 11,445 6,340
Production taxes 13,264 8,295 4,590 2,534 1,606 3,662 1,963
General and administrative 13,477 19.918 10,910 5,847 3,739 8,802 4,828
Oil and gas marketing expenses and other 71,533 119,008 103,819 58,227 29,548 75,140 32,347
Oil and gas depreciation,
depletion and amortization N95,044 146,644 127,429 60,408 36,243 103,264 50,899
Depreciation and amortization of
other assets 7,810 8,076 4,360 2,414 1,836 3,782 3,157
Impairment of assets 881,000 346,000 110,000 -236,000
Total operating costs 247,426 1,234,143 611,845 246,990 77,240 442,095 99,534
Income (loss) from operations 107,520 (856,197) (309,041) (93,092) 42,946 (173.003) 46,057
Other income (expense):
Interest and other income 8,562 3,926 87,673 78.966 2,516 11,223 3,831
Interest expense (81,052) (68,249) (29,782) (17,448) (6,216) (18,550) (13,679)
Total other income (expense) (72,490) (64,323) 57,891 61,518 (3,700) (7,327) (9,848)
Income (loss) before income taxes
and extraordinary item 35,030 (920,520) (251,150) (31,574) 39,246 (180,330) 36,209
Provision (benefit) for income taxes 1,764 (17.898) 14,325 (3,573) 12,854
Income (loss) before extraordinary item 33,266 (920,520) (233,252) (31,574) 24,921 (176,757) 23,355
Extraordinary item:
Loss on early extinguishment of debt,
net of applicable income taxes (13.334) (177) (6,443) (6,620)
Net income (loss) 33,266 (933,854) (233,429) (31,574) 18,478 (183,377) 23.355
Preferred stock dividends (16,711) (12,077)
Net income (loss) available to
common shareholders 16,555 (945,931) (233,429) (31,574) 18,478 (183,377) 23,355
Earnings (loss) per share diluted 0.16 (9.97) (3.30) (0.45) 0.28 (2.79) 0.40
Operatingcashflow 137,884 115,200 226,639 141,248 77,325 162,716 90,265
Operating cash flow per share - diluted 1.35 1.21 3.21 1.99 1.17 2.47 1.55
EBITDA 218,936 183,449 256,421 158,696 83,541 181.266 103,944
EBITDA per share - diluted 2.15 1.93 3.63 2.24 1.26 2.76 1.78
Weighted average shares outstanding diluted 102,038 94,911 70,672 70,835 66,300 65,767 58,342
Property Data ($ in thousands)
Oil reserves (MBbls) 24,795 22,593 18,226 18,226 *17,373 12,258
Gas reserves (MMcf) 1,056,826 955,791 339,118 339,118 *298,766 351,224
Reserves in equivalent thousand barrels 200,933 181,891 74,746 74,746 *67.167 70,795
Reserves in equivalent million cubic feet 1,205,595 1,091,348 448,474 448,474 *403,004 424.775
Future net revenues discounted at 10% $ 1,089,496 $660.991 $ 466.509 $ 466,509 *$ 437,386 $ 547.016
Future net revenues undiscounted $1,891,175 $1,208,641 $ 715,098 $ 715,098 *$ 611,954 $ 795,600
Oil price used in reserve report ($ per Bbl) 24.72 10.48 17.62 17.62 *18.38 20.90
Gas price used in reserve report ($ per Mc!) 2.25 1.68 2.29 2.29 *2.12 2.41
Oil production (MBbls) 4,147 5,976 3,511 1,857 1.116 2,770 1.413
Gas production (MMcI) 108,610 94.421 59,236 27,326 30,095 62,005 51,710
Production in equivalent thousand barrels 22,249 21,713 13,384 6,411 6,132 13,104 10,031
Production in equivalent million cubic feet 133,492 130,277 80,302 38,468 36,791 78,625 60,190
Average oil sales price ($ per Bbl) 16.01 12.70 19.39 18.59 21.88 20.93 17.85
Average gas sales price ($ per Mc!) 1.97 1.92 2.20 2.24 2.18 2.18 1.66
Average gas equivalent sales price ($ per Mcfe) 2.10 1.97 2.47 2.49 2.45 2.45 1.84