Chesapeake Energy 1999 Annual Report Download - page 13
Download and view the complete annual report
Please find page 13 of the 1999 Chesapeake Energy annual report below. You can navigate through the pages in the report by either clicking on the pages listed below, or by using the keyword search tool below to find specific information within the annual report.-
 1
1 -
2
-
 3
3 -
 4
4 -
 5
5 -
 6
6 -
 7
7 -
 8
8 -
 9
9 -
 10
10 -
 11
11 -
 12
12 -
 13
13 -
 14
14 -
 15
15 -
 16
16 -
 17
17 -
 18
18 -
 19
19 -
 20
20 -
 21
21 -
 22
22 -
 23
23 -
24
-
25
-
26
-
27
-
28
-
29
-
30
-
31
-
32
-
33
-
34
-
35
-
36
-
37
-
38
-
39
-
40
-
41
-
42
-
43
-
44
-
45
-
46
-
47
-
48
-
49
-
50
-
51
-
52
-
53
-
54
-
55
-
56
-
57
-
58
-
59
-
60
-
61
-
62
-
63
-
64
-
65
-
66
-
67
-
68
-
69
-
70
-
71
-
72
-
73
-
74
-
75
-
76
-
77
-
78
-
79
-
80
-
81
-
82
-
83
-
84
-
85
-
86
-
87
 |
 |

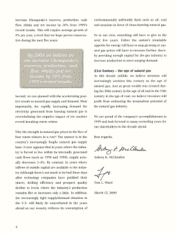
2000 Outlook. Chesapeake's strategy remains unchanged for 2000: maintain a superior operating cost structure,
fund a capital expenditure budget in balance with operating cash flow, and deliver attractive financial returns from its
assets during a time of strengthening natural gas fundamentals.
Drilling Activity
The following table sets forth the wells drilled by the Company during the periods indicated. In the table, "gross"
refers to the total wells in which the Company has a working interest and "net" refers to gross wells multiplied by the
Company's working interest therein.
Well Data
At December 31, 1999, the Company had interests in 4,719 (2,235.1 net) producing wells, of which 238 (104.6
net) were classified as primarily oil producing wells and 4,481 (2,130.5 net) were classified as primarily gas
producing wells.
Volumes, Revenue, Prices and Production Costs
The following table sets forth certain information regarding the production volumes, revenue, average prices
received and average production costs associated with the Company's sale of oil and gas for the periods indicated:
-3-
Years Ended
December31,
Six Months
Ended
December 3!,
1997
Year Ended
June 30,
1997
1999 1998
Gross Net Gross Net Gross Net Gross Net
United States
Development:
Productive 167 93.3 158 93.9 55 24.4 90 55.0
Non-productive .J.i 10.6 _4.,2 1...P.. 20.2
Total j4 1Q12 ,._,,,
167 98,6 56 24.7 92 55.2
Exploratory:
Productive 93.7 46 23.4 28 15.5 71 46.1
Non-productive
Total ,fl 4.6 _.Q2
j4 85.7
8,3 55 302 30 79 1.8
Canada
Development:
Productive 11 7.3 II 3.6
Non-productive _j 0.2 ,,.,,j ....QA
Total J2 7.5 ,,,J2 40
Exploratory:
Productive -10.3
Non-productive 7
Total -82.4