Chesapeake Energy 1999 Annual Report Download - page 4
Download and view the complete annual report
Please find page 4 of the 1999 Chesapeake Energy annual report below. You can navigate through the pages in the report by either clicking on the pages listed below, or by using the keyword search tool below to find specific information within the annual report.-
 1
1 -
 2
2 -
 3
3 -
 4
4 -
 5
5 -
 6
6 -
 7
7 -
 8
8 -
 9
9 -
 10
10 -
 11
11 -
 12
12 -
 13
13 -
 14
14 -
 15
15 -
16
-
17
-
18
-
19
-
20
-
21
-
22
-
23
-
24
-
25
-
26
-
27
-
28
-
29
-
30
-
31
-
32
-
33
-
34
-
35
-
36
-
37
-
38
-
39
-
40
-
41
-
42
-
43
-
44
-
45
-
46
-
47
-
48
-
49
-
50
-
51
-
52
-
53
-
54
-
55
-
56
-
57
-
58
-
59
-
60
-
61
-
62
-
63
-
64
-
65
-
66
-
67
-
68
-
69
-
70
-
71
-
72
-
73
-
74
-
75
-
76
-
77
-
78
-
79
-
80
-
81
-
82
-
83
-
84
-
85
-
86
-
87
 |
 |

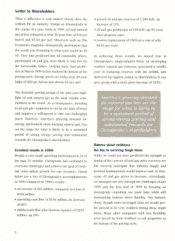
What a difference a year makes! Rarely does the
outlook for an industry change so dramatically in
the course of a year. Early in 1999, oil and natural
gas prices collapsed to near 20-year lows of $10 per
barrel and $1.50 per mcf. Observers such as The
Economist magazine dramatically proclaimed that
the world was drowning in what soon would be $5
oil. They also predicted that all commodity prices,
particularly oil and gas, were likely to stay low for
the foreseeable future. Looking back, that predic-
tion in March 1999 in fact marked the bottom of the
pricing cycle. Energy prices are today near 20-year
highs of $30 per barrel and almost $3 per mcf.
The dramatic pricing swings of the past year high-
light oil and natural gas as the most volatile com-
modities in the world. As a consequence, investing
in oil and gas companies is not for the faint of heart
and requires a willingness to ride out challenging
times. However, America's growing demand for
energy, particularly clean-burning natural gas, has
set the stage for what is likely to be a sustained
period of strong energy pricing and substantial
rewards for Chesapeake's shareholders.
Excellent results in 1999
Despite a very tough operating environment in 12 of
the past 18 months, Chesapeake has continued to
overcome challenges and achieve our goal of creat-
ing value-added growth for our investors. Listed
below are a few of Chesapeake's accomplishments
in 1999 compared to 1998's results:
net income of $33 million, compared to a loss of
$934 million
operating cash flow of $138 million, an increase
of 20%
ebitda (cash flow plus interest expense) of $219
million, up 20%
2
Letter to Shareholders
proved oil and gas reserves of 1,206 bcfe, an
increase of 11%
oil and gas production of 134 bcfe, up 3% even
after property sales
reserve replacement of 186% at a cost of only
$0.65 per mcfe
In achieving these results, we stayed true to
Chesapeake's single-minded focus on developing
onshore natural gas reserves, generated a terrific
year in replacing reserves with the drillbit, and
delivered the highest return to shareholders in our
peer group with a stock price increase of 153%.
Balance sheet resiliency -
the key to surviving tough times
While we could not have predicted the strength or
timing of the current oil and gas price recovery, we
did correctly anticipate that industry supply and
demand fundamentals would improve and, in time,
cause oil and gas prices to increase. Accordingly,
we managed our way through the challenges of late
1998 and the first half of 1999 by focusing on
strategically exploiting our asset base while still
maintaining balance sheet liquidity. Our balance
sheet, though more leveraged than we would pre-
fer, proved to be very resilient during these tough
times. Many other companies with less flexibility
were forced by their creditors to sell properties at
the bottom of the pricing cycle.