CenturyLink 2004 Annual Report Download - page 19
Download and view the complete annual report
Please find page 19 of the 2004 CenturyLink annual report below. You can navigate through the pages in the report by either clicking on the pages listed below, or by using the keyword search tool below to find specific information within the annual report.-
 1
1 -
2
-
3
-
4
-
5
-
6
-
7
-
8
-
 9
9 -
 10
10 -
 11
11 -
 12
12 -
 13
13 -
 14
14 -
 15
15 -
 16
16 -
 17
17 -
 18
18 -
 19
19 -
 20
20 -
 21
21 -
 22
22 -
 23
23 -
 24
24 -
 25
25 -
 26
26 -
 27
27 -
 28
28
 |
 |

[ 17 ]
Financial Highlights
Dollars, except per share amounts,
and shares in thousands
5-year
2004 2003 2002 2001 2000 CAGR(1)
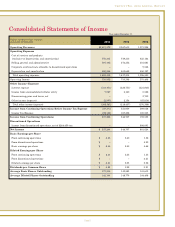
Operating revenues
from continuing operations $2,407,372 2,367,610 1,971,996 1,679,504 1,402,357 13.9%
Operating income
from continuing operations $ 753,953 750,396 575,406 425,305 386,137 16.3%
Depreciation
and amortization $ 500,904 503,652 450,197 440,404 352,342 11.0%
Income from continuing
operations, as adjusted(2) $ 337,244 344,707 193,533 195,408 164,044 15.3%
Net income $ 337,244 344,707 801,624 343,031 231,474 7.1%
Net income, as adjusted(2) $ 337,244 344,707 801,624 399,297 278,029 3.7%
Diluted earnings per share
from continuing operations,
as adjusted(2) $ 2.41 2.35 1.35 1.37 1.16 15.5%
Diluted earnings per share,
as adjusted(2) $ 2.41 2.35 5.56 2.81 1.96 3.9%
Dividends per common share $ 0.23 0.22 0.21 0.20 0.19 5.0%
Average diluted shares
outstanding 142,144 148,779 144,408 142,307 141,864 0.1%
Number of common
shareholders 4,720 4,613 5,181 5,460 5,714 (1.7%)
Total assets $7,796,953 7,895,852 7,770,408 6,318,684 6,393,290 10.6%
Long-term debt $2,762,019 3,109,302 3,578,132 2,087,500 3,050,292 5.9%
Stockholders’ equity $3,409,765 3,478,516 3,088,004 2,337,380 2,032,079 13.0%
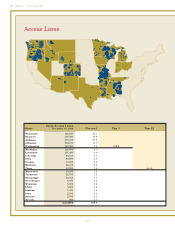
Telephone access lines 2,313,626 2,376,118 2,414,564 1,797,643 1,800,565 12.7%
Long distance lines 1,067,817 931,761 798,697 564,851 433,846 24.5%
(1) Five-year compounded annual growth rate
(2) As adjusted to reflect the effect of eliminating goodwill amortization in accordance with SFAS 142 for periods prior to 2002.
Total Assets
(in millions)
Operating Revenues
from Continuing
Operations
(in millions)
1,402
1,680
00 01 02 03 04
1,972
2,368 2,4 07
Income from
Continuing
Operations,
as Adjusted
(in millions)
164 1 95
00 01 0 2 03 04
194
345 3 37
Diluted EPS
from Continuing
Operations,
as Adjusted
1.16 1.37
00 01 02 03 04
1.35
2.35 2.41
6,393 6,319
00 01 02 03 04
7,770 7,896 7,797
CENTURYTEL 2004 ANNUAL REPORT