Cathay Pacific 2014 Annual Report Download - page 4
Download and view the complete annual report
Please find page 4 of the 2014 Cathay Pacific annual report below. You can navigate through the pages in the report by either clicking on the pages listed below, or by using the keyword search tool below to find specific information within the annual report.-
 1
1 -
 2
2 -
 3
3 -
 4
4 -
 5
5 -
 6
6 -
 7
7 -
 8
8 -
 9
9 -
 10
10 -
 11
11 -
 12
12 -
 13
13 -
 14
14 -
 15
15 -
16
-
17
-
18
-
19
-
20
-
21
-
22
-
23
-
24
-
25
-
26
-
27
-
28
-
29
-
30
-
31
-
32
-
33
-
34
-
35
-
36
-
37
-
38
-
39
-
40
-
41
-
42
-
43
-
44
-
45
-
46
-
47
-
48
-
49
-
50
-
51
-
52
-
53
-
54
-
55
-
56
-
57
-
58
-
59
-
60
-
61
-
62
-
63
-
64
-
65
-
66
-
67
-
68
-
69
-
70
-
71
-
72
-
73
-
74
-
75
-
76
-
77
-
78
-
79
-
80
-
81
-
82
-
83
-
84
-
85
-
86
-
87
-
88
-
89
-
90
-
91
-
92
-
93
-
94
-
95
-
96
-
97
-
98
-
99
-
100
-
101
-
102
-
103
-
104
-
105
-
106
-
107
-
108
-
109
-
110
-
111
-
112
 |
 |

Cathay Pacific Airways Limited
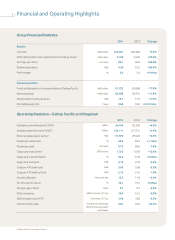
2Financial and Operating Highlights
Group Financial Statistics
2014 2013 Change
Results
Turnover HK$ million 105,991 100,484 +5.5%
Profit attributable to the shareholders of Cathay Pacific HK$ million 3,150 2,620 +20.2%
Earnings per share HK cents 80.1 66.6 +20.3%
Dividend per share HK$ 0.36 0.22 +63.6%
Profit margin %3.0 2.6 +0.4%pt
Financial position
Funds attributable to the shareholders of Cathay Pacific HK$ million 51,722 62,888 -17.8%
Net borrowings HK$ million 43,998 39,316 +11.9%
Shareholders' funds per share HK$ 13.1 15.9 -17.6%
Net debt/equity ratio Times 0.85 0.63 +0.22 times
Operating Statistics – Cathay Pacific and Dragonair
2014 2013 Change
Available tonne kilometres (“ATK”) Million 28,440 26,259 +8.3%
Available seat kilometres (“ASK”) Million 134,711 127,215 +5.9%
Revenue passengers carried ‘000 31,570 29,920 +5.5%
Passenger load factor %83.3 82.2 +1.1%pt
Passenger yield HK cents 67.3 68.5 -1.8%
Cargo and mail carried ‘000 tonnes 1,723 1,539 +12.0%
Cargo and mail load factor %64.3 61.8 +2.5%pt
Cargo and mail yield HK$ 2.19 2.32 -5.6%
Cost per ATK (with fuel) HK$ 3.50 3.58 -2.2%
Cost per ATK (without fuel) HK$ 2.12 2.16 -1.9%
Aircraft utilisation Hours per day 12.2 11.8 +3.4%
On-time performance %70.1 75.5 -5.4%pt
Average age of fleet Years 9.1 9.3 -2.2%
GHG emissions Million tonnes of CO2e15.0 15.5 -3.2%
GHG emissions per ATK Grammes of CO2e576 589 -2.2%
Lost time injury rate Number of injuries per
100 full-time equivalent
employees
3.67 4.84 -24.2%