Cathay Pacific 2014 Annual Report Download - page 18
Download and view the complete annual report
Please find page 18 of the 2014 Cathay Pacific annual report below. You can navigate through the pages in the report by either clicking on the pages listed below, or by using the keyword search tool below to find specific information within the annual report.-
 1
1 -
2
-
3
-
4
-
5
-
6
-
7
-
 8
8 -
 9
9 -
 10
10 -
 11
11 -
 12
12 -
 13
13 -
 14
14 -
 15
15 -
 16
16 -
 17
17 -
 18
18 -
 19
19 -
 20
20 -
 21
21 -
 22
22 -
 23
23 -
 24
24 -
 25
25 -
 26
26 -
 27
27 -
 28
28 -
29
-
30
-
31
-
32
-
33
-
34
-
35
-
36
-
37
-
38
-
39
-
40
-
41
-
42
-
43
-
44
-
45
-
46
-
47
-
48
-
49
-
50
-
51
-
52
-
53
-
54
-
55
-
56
-
57
-
58
-
59
-
60
-
61
-
62
-
63
-
64
-
65
-
66
-
67
-
68
-
69
-
70
-
71
-
72
-
73
-
74
-
75
-
76
-
77
-
78
-
79
-
80
-
81
-
82
-
83
-
84
-
85
-
86
-
87
-
88
-
89
-
90
-
91
-
92
-
93
-
94
-
95
-
96
-
97
-
98
-
99
-
100
-
101
-
102
-
103
-
104
-
105
-
106
-
107
-
108
-
109
-
110
-
111
-
112
 |
 |

Cathay Pacific Airways Limited
16
%
40
50
60
70
80
90
%
0
20
40
60
80
100
20
30
40
50
60
70
2010 2011 2012 2013 2014
2010 2011 2012 2013 2014
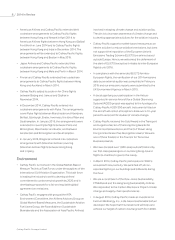
Load factor by region
North Asia
Southwest
Pacic and
South Africa
Southeast
Asia
Europe North AmericaIndia, Middle East,
Pakistan and
Sri Lanka
HK cents
Passenger load factor and yield
YieldPassenger load factor
Review of Operations Passenger Services
Our passenger business continued to grow in 2014. Cathay Pacific and Dragonair carried
31.6 million passengers, an increase of 5.5% compared to 2013. Revenue increased by 5.4%
to HK$75,734 million. The load factor increased by 1.1 percentage points to 83.3%. Yield
decreased by 1.8% to HK67.3 cents. Capacity increased by 5.9% as a result of the
introduction of new routes (to Doha, Manchester and Newark) and increased frequencies on
some existing routes. Passenger demand was strong in all classes of travel on long-haul
routes. However, the increase in passenger numbers did not match the increase in capacity
on North American routes. Strong competition put downward pressure on yield on regional
routes. The profitability of our passenger operations was improved by lower fuel prices in
the fourth quarter of 2014, but this was partially offset by fuel hedging losses. Using more
Boeing 777-300ER aircraft on long-haul flights improved our operating economics.
Available seat kilometres (“ASK”), load factor and yield by region for
Cathay Pacific and Dragonair passenger services for 2014 were as follows:
ASK (million) Load factor (%) Yield
2014 2013 Change 2014 2013 Change Change
India, Middle East, Pakistan and
Sri Lanka 10,685 10,697 -0.1% 80.1 75.5 +4.6%pt -1.7%
Southwest Pacific and South Africa 18,032 17,490 +3.1% 85.1 80.7 +4.4%pt -1.7%
Southeast Asia 18,625 18,246 +2.1% 81.3 80.3 +1.0%pt -1.9%
Europe 21,056 21,536 -2.2% 88.0 87.3 +0.7%pt +4.6%
North Asia 29,649 28,450 +4.2% 77.9 75.8 +2.1%pt -3.0%
North America 36,664 30,796 +19.1% 86.1 88.8 -2.7%pt -3.9%
Overall 134,711 127,215 +5.9% 83.3 82.2 +1.1%pt -1.8%