Cathay Pacific 2000 Annual Report Download - page 20
Download and view the complete annual report
Please find page 20 of the 2000 Cathay Pacific annual report below. You can navigate through the pages in the report by either clicking on the pages listed below, or by using the keyword search tool below to find specific information within the annual report.-
 1
1 -
2
-
3
-
4
-
5
-
6
-
7
-
8
-
9
-
 10
10 -
 11
11 -
 12
12 -
 13
13 -
 14
14 -
 15
15 -
 16
16 -
 17
17 -
 18
18 -
 19
19 -
 20
20 -
 21
21 -
 22
22 -
 23
23 -
 24
24 -
 25
25 -
 26
26 -
 27
27 -
 28
28 -
 29
29 -
 30
30 -
31
-
32
-
33
-
34
-
35
-
36
-
37
-
38
-
39
-
40
-
41
-
42
-
43
-
44
-
45
-
46
-
47
-
48
-
49
-
50
-
51
-
52
-
53
-
54
-
55
-
56
-
57
-
58
-
59
-
60
-
61
-
62
-
63
-
64
-
65
-
66
-
67
-
68
-
69
-
70
-
71
-
72
-
73
-
74
-
75
-
76
-
77
-
78
-
79
-
80
-
81
-
82
-
83
 |
 |

18 CATHAY PACIFIC AIRWAYS LIM ITED ANNUAL REPORT 2000
Group turnover w as up by 20.3% compared
with 1999.
Turnover of passenger services rose by
20.5% to HK$22,878 million as a result of an
improvement in both load factors and yields.
The number of passengers carried increased
by 12.8% to 11.9 million.
Passenger traffic (measured by revenue
passenger kilometres) increased by 13.6%
against a 6.5% increase in passenger seat
capacity (measured by available seat
kilometres), w hich resulted in an increase in
the passenger load factor from 71.4% to 76.2% .
Passenger yield improved by 6.2% to
HK¢48.2 as a result of higher front-end
traffic and price increases.
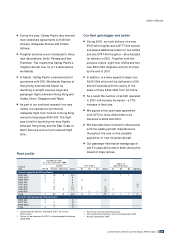
Financial Review
The Group’s attributable profit was HK$5,005 million as compared with a profit of
HK$2,180 million in 1999. The improvement reflects a further recovery in Asian markets.
Turnover
Group Cathay Pacific
2000 1999 2000 1999
HK$M HK$M HK$M HK$M
Passenger services 22,878 18,979 22,878 18,979
Cargo services 10,136 8,391 8,615 7,071
Catering and other services 1,509 1,332 ––
Turnover 34,523 28,702 31,493 26,050
Group turnover
HK$ million
0
5,000
10,000
15,000
20,000
25,000
30,000
35,000
Passenger services
Catering and other services
Cargo services
20001999199819971996
Composition of group turnover
67% Passenger services
29% Cargo services
4% Catering and other services