Cathay Pacific 2000 Annual Report Download - page 14
Download and view the complete annual report
Please find page 14 of the 2000 Cathay Pacific annual report below. You can navigate through the pages in the report by either clicking on the pages listed below, or by using the keyword search tool below to find specific information within the annual report.-
 1
1 -
2
-
3
-
 4
4 -
 5
5 -
 6
6 -
 7
7 -
 8
8 -
 9
9 -
 10
10 -
 11
11 -
 12
12 -
 13
13 -
 14
14 -
 15
15 -
 16
16 -
 17
17 -
 18
18 -
 19
19 -
 20
20 -
 21
21 -
 22
22 -
 23
23 -
 24
24 -
25
-
26
-
27
-
28
-
29
-
30
-
31
-
32
-
33
-
34
-
35
-
36
-
37
-
38
-
39
-
40
-
41
-
42
-
43
-
44
-
45
-
46
-
47
-
48
-
49
-
50
-
51
-
52
-
53
-
54
-
55
-
56
-
57
-
58
-
59
-
60
-
61
-
62
-
63
-
64
-
65
-
66
-
67
-
68
-
69
-
70
-
71
-
72
-
73
-
74
-
75
-
76
-
77
-
78
-
79
-
80
-
81
-
82
-
83
 |
 |

12 CATHAY PACIFIC AIRWAYS LIM ITED ANNUAL REPORT 2000
Review of Operations
Passenger services
With the recovery of Asian economies, 2000 was an encouraging year. Passenger
revenue was helped by both the increase in passenger numbers and the rise in yields.
North Asian and North American routes performed strongly. However our European
routes were affected by weakening European currencies.
Substantial grow th w as seen in our key
markets of Australia, Canada, Hong Kong,
Japan, Korea, the Philippines, Taiwan and
U.S.A. The number of business-related
passengers increased, improving load
factors in first and business classes.
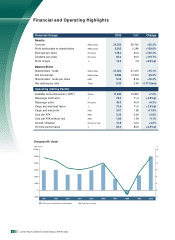
Available seat kilometres (“ASK”), load factor and yield:
ASK (m illion) Load Factor (%) Yield
2000 1999 Change 2000 1999 Change Change
North Asia 9,912 9,475 +4.6% 74.1 67.0 +7.1%pt +9.5%
South East Asia and
Middle East 12,097 11,261 +7.4% 72.6 70.6 +2.0%pt +5.2%
Europe 14,565 13,905 +4.7% 80.8 7 4.5 +6.3%pt +1.4%
Pacific and South Africa 25,335 23,473 +7.9% 76.0 71.8 +4.2%pt +7.1%
Overall 61,909 58,114 +6.5% 76.2 71.4 +4.8%pt +6.2%
Revenue generated from our oneworld
alliance continued to increase w ith
seamless travel now being offered to more
offline destinations. The addition of extra
frequencies helped to increase market
share.
Load factor by region
%
0
20
40
60
80
100
20001999199819971996
South East
Asia and
Middle East
North Asia Pacific and
South Africa
Europe
0
20
40
60
80
Passenger load factor
0
20
40
60
80
Yield
20001999199819971996
Passenger load factor and yield
% HK cents