Casio 2010 Annual Report Download - page 19
Download and view the complete annual report
Please find page 19 of the 2010 Casio annual report below. You can navigate through the pages in the report by either clicking on the pages listed below, or by using the keyword search tool below to find specific information within the annual report.-
 1
1 -
2
-
3
-
4
-
5
-
6
-
7
-
8
-
 9
9 -
 10
10 -
 11
11 -
 12
12 -
 13
13 -
 14
14 -
 15
15 -
 16
16 -
 17
17 -
 18
18 -
 19
19 -
 20
20 -
 21
21 -
 22
22 -
 23
23 -
 24
24 -
 25
25 -
 26
26 -
 27
27 -
 28
28 -
 29
29 -
30
-
31
-
32
-
33
-
34
-
35
-
36
-
37
-
38
-
39
-
40
-
41
-
42
-
43
-
44
-
45
-
46
-
47
-
48
-
49
-
50
-
51
-
52
 |
 |

17
Annual Report 2010
Results by Region
Sales in Japan recorded a year-on-year decline of 16.8% to ¥222,835 million, accounting for 52.1% of total sales.
Sales in North America decreased 23.9% to ¥64,916 million, accounting for 15.2% of all sales, while European sales
declined 15.1% to ¥60,467 million, accounting for 14.1% of the total. Sales in Asia and the other regions (excluding
Japan) declined 15.0% to ¥79,707 million, accounting for 18.6% of total sales. Overall, overseas sales declined
18.1% year-on-year to ¥205,090 million.
Results of Operations
The Electronics segment posted a ¥19,953 million operating loss, due mainly to sharply reduced revenues in the cell
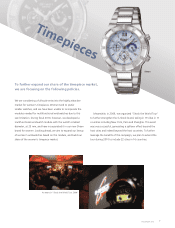
phone business. By contrast, timepieces and electronic dictionaries remained earnings drivers, and digital cameras
saw steady improvement in profitability from the second half.
The Electronic Components and Others segment posted an operating loss of ¥4,801 million, helping push the
Company into an operating loss of ¥29,309 million on a consolidated basis, allowing for elimination or unallocated
amounts.
The financial account balance for the reporting year fell to ¥585 million from ¥1,532 million in the previous year.
Net other expenses declined to ¥834 million, from ¥34,596 million in the previous year.
For the year under review, the Company posted a net loss of ¥20,968 million. One factor was an extraordinary
loss incurred due to posting of business structure improvement expenses (provision for business structure improve-
ment) in anticipation of losses from subsidiary merger due to integration of cell phone businesses.
Financial Condition
Total assets at the end of March 2010 declined 3.3% year-on-year to ¥429,983 million. Current assets declined
by ¥2,749 million to ¥275,450 million, largely as a result of a decrease in notes and accounts receivable-trade and
accounts receivable-other. Noncurrent assets posted a year-on-year decline of ¥11,921 million to ¥154,533 million
due chiefly to a decline in property, plant and equipment (buildings and structures, and machinery and equipment),
as well as in deferred tax assets.
Total liabilities edged up 0.6% year-on-year to ¥261,126 million. Current liabilities fell ¥16,486 million year-on-
year to ¥153,115 million, due primarily to a decrease in trade payables. Noncurrent liabilities increased by ¥17,940
million year-on-year to ¥108,011 million, due chiefly to an increase in long-term loans payable.
Net assets at the year-end fell 8.7% year-on-year to ¥168,857 million, reflecting a decrease primarily in retained
earnings and in valuation and translation adjustments, as well as an increase in minority interests.