Casio 2000 Annual Report Download - page 3
Download and view the complete annual report
Please find page 3 of the 2000 Casio annual report below. You can navigate through the pages in the report by either clicking on the pages listed below, or by using the keyword search tool below to find specific information within the annual report.
1
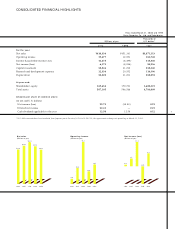
CONSOLIDATED FINANCIAL HIGHLIGHTS
Thousands of
Millions of yen U.S. dollars*
20 0 0 1999 2000
For the year:
Net sales ¥410,338 ¥451,141 $3,871,113
Operating income 19,477 12,551 183,745
Income (Loss) before income taxes 12,275 (8,495) 115,802
Net income (loss) 6,173 (8,534) 58,236
Capital investment 35,546 31,212 335,340
Research and development expenses 12,338 20,552 116,396
Depreciation 30,220 31,001 285,094
At year-end:
Shareholders’ equity 169,634 170,721 1,600,321
Total assets 507,105 506,566 4,784,009
Amounts per share of common stock:
(in yen and U.S. dollars):
Net income (loss) 22.73 (30.90) 0.21
Diluted net income 22.41 —0.21
Cash dividends applicable to the year 12.50 12.50 0.12
* U.S. dollar amounts have been translated from Japanese yen at the rate of ¥106 to U.S.$1.00, the approximate exchange rate prevailing on March 31, 2000.
Years ended March 31, 2000 and 1999
Casio Computer Co., Ltd. and Subsidiaries
Net sales
(Billions of yen)
19 9 6 1 9 97 19 9 8 1 999 20 0 0
41 1 .9
45 9 .1
50 2 .0
45 1 .1
41 0 .3
Net income (loss)
(Billions of yen)
Operating income
(Billions of yen)
19 9 6 1 9 97 19 9 8 1 999 20 0 0
5.0
15 .9
42 .2
12 .6
19 .5
19 9 6 1 9 97 19 9 8 1 999 20 0 0
0.7
3.7
11 .7
(8.5 )
6.2


