Cash America 2014 Annual Report Download - page 10
Download and view the complete annual report
Please find page 10 of the 2014 Cash America annual report below. You can navigate through the pages in the report by either clicking on the pages listed below, or by using the keyword search tool below to find specific information within the annual report.-
 1
1 -
 2
2 -
 3
3 -
 4
4 -
 5
5 -
 6
6 -
 7
7 -
 8
8 -
 9
9 -
 10
10 -
 11
11 -
 12
12 -
 13
13 -
 14
14 -
 15
15 -
 16
16 -
 17
17 -
 18
18 -
 19
19 -
 20
20 -
 21
21 -
22
-
23
-
24
-
25
-
26
-
27
-
28
-
29
-
30
-
31
-
32
-
33
-
34
-
35
-
36
-
37
-
38
-
39
-
40
-
41
-
42
-
43
-
44
-
45
-
46
-
47
-
48
-
49
-
50
-
51
-
52
-
53
-
54
-
55
-
56
-
57
-
58
-
59
-
60
-
61
-
62
-
63
-
64
-
65
-
66
-
67
-
68
-
69
-
70
-
71
-
72
-
73
-
74
-
75
-
76
-
77
-
78
-
79
-
80
-
81
-
82
-
83
-
84
-
85
-
86
-
87
-
88
-
89
-
90
-
91
-
92
-
93
-
94
-
95
-
96
-
97
-
98
-
99
-
100
-
101
-
102
-
103
-
104
-
105
-
106
-
107
-
108
-
109
-
110
-
111
-
112
-
113
-
114
-
115
-
116
-
117
-
118
-
119
-
120
-
121
-
122
-
123
-
124
-
125
-
126
-
127
-
128
-
129
-
130
-
131
-
132
-
133
-
134
-
135
-
136
-
137
-
138
-
139
-
140
-
141
-
142
-
143
-
144
-
145
-
146
-
147
-
148
-
149
-
150
-
151
-
152
-
153
-
154
-
155
-
156
-
157
-
158
-
159
-
160
-
161
-
162
-
163
-
164
-
165
-
166
-
167
-
168
-
169
-
170
-
171
 |
 |

Storefront Lending
No Lending Activity
Legend for Geographic
Market Presence
AlaskaAlaska
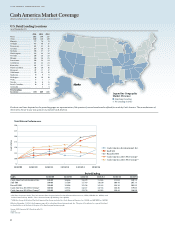
Cash America Market Coverage
Retail Lending locations and market coverage as of December 31.
U.S. Retail Lending Locations
(as of December 31)
2014 2013 2012
Texas ................................ 262 260 257
Ohio .................................. 120 120 120
Florida .............................. 77 76 75
Georgia ............................ 47 48 17
Tennessee ........................ 41 41 41
Arizona ............................ 37 36 37
Indiana ............................ 36 37 37
Washington ..................... 33 34 34
Nevada ............................. 28 28 28
Illinois .............................. 26 26 25
Louisiana ......................... 24 24 24
California ........................ 21 23 23
Kentucky .......................... 21 21 22
North Carolina ............... 18 20 16
Missouri ........................... 17 17 17
Oklahoma ........................ 15 15 15
Alabama........................... 9 9 9
Michigan ......................... 8 10 10
Utah .................................. 7 7 7
Alaska ............................... 6 6 6
South Carolina................ 6 6 6
Colorado .......................... - 5 5
Total Lending
Locations ......................... 859 869 831
CASH AMERICA INTERNATIONAL, INC.
8
12/31/09 12/31/10 12/31/11 12/31/12 12/31/13 12/31/14
250
225
200
175
150
125
100
75
Total Return Performance
Index Value
Cash America International, Inc.
S&P 500
Russell 2000
Cash America 2013 Peer Group*
Cash America 2014 Peer Group**
Period Ending
Index 12/31/09 12/31/10 12/31/11 12/31/12 12/31/13 12/31/14
Cash America International, Inc. 100.00 106.06 134.29 114.63 111.04 140.13
S&P 500 100.00 115.06 117.49 136.30 180.44 205.14
Russell 2000 100.00 126.86 121.56 141.43 196.34 205.95
Cash America 2013 Peer Group* 100.00 139.34 142.27 147.53 130.36 119.03
Cash America 2014 Peer Group** 100.00 149.54 155.76 162.83 158.44 146.88
*CSH Peer Group 2013 Index: The Cash America Peer Group includes First Cash Financial Services, Inc. (FCFS), EZCORP, Inc. (EZPW), and
Dollar Financial Corp. (DLLR – This is historical now), QC Holdings, Inc. (QCCO)
**CSH Peer Group 2014 Index: The Cash America Peer Group includes First Cash Financial Services, Inc. (FCFS) and EZCORP, Inc. (EZPW).
Effective November 13, 2014, the Company spun-off its subsidiary, Enova International, Inc. The spin-off is reflected as a special dividend
to shareholders as of the date of the spin-off in the above performance graph.
Source: SNL Financial LC, Charlottesville, VA
© 2015
www.snl.com
Products and items depicted on the preceding pages are representative of the previously owned merchandise offered for resale by Cash America. The manufacturers of
these items do not in any way sponsor or promote Cash America.