Callaway 2001 Annual Report Download - page 10
Download and view the complete annual report
Please find page 10 of the 2001 Callaway annual report below. You can navigate through the pages in the report by either clicking on the pages listed below, or by using the keyword search tool below to find specific information within the annual report.-
 1
1 -
 2
2 -
 3
3 -
 4
4 -
 5
5 -
 6
6 -
 7
7 -
 8
8 -
 9
9 -
 10
10 -
 11
11 -
 12
12 -
 13
13 -
 14
14 -
 15
15 -
 16
16 -
 17
17 -
 18
18 -
 19
19 -
 20
20 -
 21
21 -
22
-
23
-
24
-
25
-
26
-
27
-
28
-
29
-
30
-
31
-
32
-
33
-
34
-
35
-
36
-
37
-
38
-
39
-
40
-
41
-
42
-
43
-
44
-
45
-
46
-
47
-
48
-
49
-
50
-
51
-
52
-
53
-
54
-
55
-
56
-
57
-
58
-
59
-
60
-
61
-
62
-
63
-
64
 |
 |

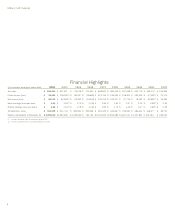
Callaway Golf Company
8
(in thousands, except per share data)
Net sales
Pretax income (loss)
Net income (loss)
Basic earnings (loss) per share
Diluted earnings (loss) per share
Shareholders’ equity
Market capitalization at December 31
1992199319941995199619971998199920002001
132,956256,376451,779557,048683,536848,941703,060719,038837,627816,163
33,17567,942(2)
129,405158,401195,595213,765(38,899)85,497128,365(1)
98,192
19,28042,862(2)
78,02297,736122,337132,704(26,564)55,32280,999(1)
58,375
0.350.68(2)
1.141.471.831.94(0.38)0.791.16(1)
0.84
0.320.62(2)
1.071.401.731.85(0.38)0.781.13(1)
0.82
49,750116,577186,414224,934362,267481,425453,096499,934511,744514,349
245,254
$
$
$
$
$
$
$
$
$
$
$
$
$
$
$
$
$
$
$
$
$
$
$
$
$
$
$
$
$
$
$
$
$
$
$
$
$
$
$
$
$
$
$
$
$
$
$
$
$
$
$
$
$
$
$
$
$
$
$
$
$
$
$
$
$
$
$
$
$
$901,910 1,127,8231,604,7412,094,5882,120,813769,7251,349,5951,380,9261,489,012
(1) Includes cumulative effect of accounting change of $957.
(2) Includes cumulative effect of accounting change of $1,658.
Financial Highlights