Bridgestone 2004 Annual Report Download - page 2
Download and view the complete annual report
Please find page 2 of the 2004 Bridgestone annual report below. You can navigate through the pages in the report by either clicking on the pages listed below, or by using the keyword search tool below to find specific information within the annual report.-
 1
1 -
 2
2 -
 3
3 -
 4
4 -
 5
5 -
 6
6 -
 7
7 -
 8
8 -
 9
9 -
 10
10 -
 11
11 -
 12
12 -
 13
13 -
14
-
15
-
16
-
17
-
18
-
19
-
20
-
21
-
22
-
23
-
24
-
25
-
26
-
27
-
28
-
29
-
30
-
31
-
32
-
33
-
34
-
35
-
36
-
37
-
38
-
39
-
40
-
41
-
42
-
43
-
44
-
45
-
46
-
47
-
48
-
49
-
50
-
51
-
52
-
53
-
54
-
55
-
56
-
57
-
58
-
59
-
60
-
61
-
62
 |
 |

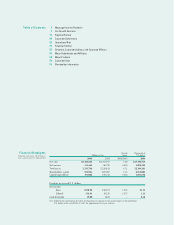
2Message from the President
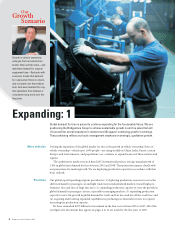
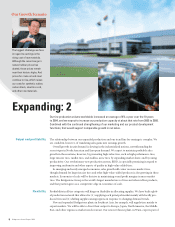
4Our Growth Scenario
12 Regional Review
20 Corporate Governance
22 Operational Risk
26 Financial Section
55 Directors, Corporate Auditors, and Corporate Officers
56 Major Subsidiaries and Affiliates
58 Major Products
59 Corporate Data
59 Shareholder Information
Financial Highlights
Bridgestone Corporation and Subsidiaries
Years ended December 31, 2004 and 2003
Percent Thousands of
Millions of yen change U.S. dollars
2004 2003 2004/2003 2004
Net sales ¥2,416,685 ¥2,303,917 +4.9 $23,190,529
Net income 114,453 88,720 +29.0 1,098,292
Total assets 2,333,708 2,220,613 +5.1 22,394,281
Shareholders’ equity 934,981 887,987 +5.3 8,972,085
Capital expenditure 191,000 155,742 +22.6 1,832,838
Per share in yen and U.S. dollars
Net income
Basic ¥138.96 ¥102.75 +35.2 $1.33
Diluted 138.94 102.56 +35.5 1.33
Cash dividends 19.00 16.00 – 0.18
Note: Solely for the convenience of readers, the Japanese yen amounts in this annual report are translated into
U.S. dollars at the rate of ¥104.21 to $1, the approximate fiscal year-end rate.
Table of Contents