Barnes and Noble 2005 Annual Report Download - page 13
Download and view the complete annual report
Please find page 13 of the 2005 Barnes and Noble annual report below. You can navigate through the pages in the report by either clicking on the pages listed below, or by using the keyword search tool below to find specific information within the annual report.-
 1
1 -
2
-
 3
3 -
 4
4 -
 5
5 -
 6
6 -
 7
7 -
 8
8 -
 9
9 -
 10
10 -
 11
11 -
 12
12 -
 13
13 -
 14
14 -
 15
15 -
 16
16 -
 17
17 -
 18
18 -
 19
19 -
 20
20 -
 21
21 -
 22
22 -
 23
23 -
24
-
25
-
26
-
27
-
28
-
29
-
30
-
31
-
32
-
33
-
34
-
35
-
36
-
37
-
38
-
39
-
40
-
41
-
42
-
43
-
44
-
45
-
46
-
47
-
48
-
49
-
50
-
51
-
52
-
53
-
54
 |
 |

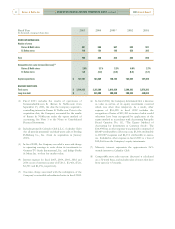
The following table sets forth, for the periods indicated, the percentage relationship that certain items bear to total sales
of the Company:
Fiscal Year 2005 2004 2003
Sales
100.0% 100.0% 100.0%
Cost of sales and occupancy
69.2 69.5 70.0
Gross margin
30.8 30.5 30.0
Selling and administrative expenses
22.2 21.6 20.8
Depreciation and amortization
3.4 3.7 3.8
Pre-opening expenses
0.2 0.2 0.2
Operating margin
4.9 5.0 5.2
Interest expense, net and amortization of deferred financing fees
— (0.2) (0.5)
Debt redemption charge
— (0.3) —
Equity in net loss of Barnes & Noble.com
— — (0.3)
Earnings before income taxes and minority interest
4.9 4.5 4.4
Income taxes
2.0 1.9 1.8
Income before minority interest
2.9 2.6 2.6
Minority interest
— (0.1) (0.1)
Income from continuing operations
2.9% 2.5% 2.5%
[MANAGEMENT’S DISCUSSION AND
ANALYSIS OF FINANCIAL CONDITION AND RESULTS
OF OPERATIONS continued ]
12
2005 Annual ReportBarnes & Noble, Inc.