Barclays 2009 Annual Report Download - page 5
Download and view the complete annual report
Please find page 5 of the 2009 Barclays annual report below. You can navigate through the pages in the report by either clicking on the pages listed below, or by using the keyword search tool below to find specific information within the annual report.-
 1
1 -
 2
2 -
 3
3 -
 4
4 -
 5
5 -
 6
6 -
 7
7 -
 8
8 -
 9
9 -
 10
10 -
 11
11 -
 12
12 -
 13
13 -
 14
14 -
 15
15 -
 16
16 -
17
-
18
-
19
-
20
-
21
-
22
-
23
-
24
-
25
-
26
-
27
-
28
-
29
-
30
-
31
-
32
-
33
-
34
-
35
-
36
-
37
-
38
-
39
-
40
-
41
-
42
-
43
-
44
-
45
-
46
-
47
-
48
-
49
-
50
-
51
-
52
-
53
-
54
-
55
-
56
-
57
-
58
-
59
-
60
-
61
-
62
-
63
-
64
-
65
-
66
-
67
-
68
-
69
-
70
-
71
-
72
-
73
-
74
-
75
-
76
-
77
-
78
-
79
-
80
-
81
-
82
-
83
-
84
-
85
-
86
-
87
-
88
-
89
-
90
-
91
-
92
-
93
-
94
-
95
-
96
-
97
-
98
-
99
-
100
-
101
-
102
-
103
-
104
-
105
-
106
-
107
-
108
-
109
-
110
-
111
-
112
-
113
-
114
-
115
-
116
-
117
-
118
-
119
-
120
-
121
-
122
-
123
-
124
-
125
-
126
-
127
-
128
-
129
-
130
-
131
-
132
-
133
-
134
-
135
-
136
-
137
-
138
-
139
-
140
-
141
-
142
-
143
-
144
-
145
-
146
-
147
-
148
-
149
-
150
-
151
-
152
-
153
-
154
-
155
-
156
-
157
-
158
-
159
-
160
-
161
-
162
-
163
-
164
-
165
-
166
-
167
-
168
-
169
-
170
-
171
-
172
-
173
-
174
-
175
-
176
-
177
-
178
-
179
-
180
-
181
-
182
-
183
-
184
-
185
-
186
-
187
-
188
-
189
-
190
-
191
-
192
-
193
-
194
-
195
-
196
-
197
-
198
-
199
-
200
-
201
-
202
-
203
-
204
-
205
-
206
-
207
-
208
-
209
-
210
-
211
-
212
-
213
-
214
-
215
-
216
-
217
-
218
-
219
-
220
-
221
-
222
-
223
-
224
-
225
-
226
-
227
-
228
-
229
-
230
-
231
-
232
-
233
-
234
-
235
-
236
-
237
-
238
-
239
-
240
-
241
-
242
-
243
-
244
-
245
-
246
-
247
-
248
-
249
-
250
-
251
-
252
-
253
-
254
-
255
-
256
-
257
-
258
-
259
-
260
-
261
-
262
-
263
-
264
-
265
-
266
-
267
-
268
-
269
-
270
-
271
-
272
-
273
-
274
-
275
-
276
-
277
-
278
-
279
-
280
-
281
-
282
-
283
-
284
-
285
-
286
-
287
-
288
-
289
-
290
-
291
-
292
-
293
-
294
-
295
-
296
-
297
-
298
-
299
-
300
-
301
-
302
-
303
-
304
-
305
-
306
-
307
-
308
-
309
-
310
-
311
-
312
-
313
-
314
-
315
-
316
-
317
-
318
-
319
-
320
-
321
-
322
-
323
-
324
-
325
-
326
-
327
-
328
-
329
-
330
-
331
-
332
-
333
-
334
-
335
-
336
-
337
-
338
-
339
-
340
-
341
-
342
-
343
-
344
-
345
-
346
-
347
-
348
 |
 |

www.barclays.com/annualreport09 Barclays PLC Annual Report 2009 03
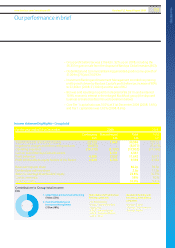
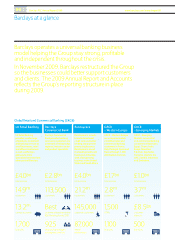
Our performance in brief
– Group profit before tax was £11,642m, 92% up on 2008, including the
£6,331m gain on sale from the disposal of Barclays Global Investors (BGI)
– Global Retail and Commercial Banking generated good income growth of
£1,004m (7%) to £16,097m
– Investment Banking and Investment Management recorded very strong
profit growth driven by Barclays Capital’s profit before tax increase of 89%
to £2,464m (2008: £1,302m) and the sale of BGI
– BGI was sold resulting in a profit on disposal of £6,331m and a retained
19.9% economic interest in the enlarged BlackRock group (the disposed
business is treated as discontinued operations below)
– Core Tier 1 capital ratio was 10.0% at 31st December 2009 (2008: 5.6%)
and Tier 1 capital ratio was 13.0% (2008: 8.6%)
12
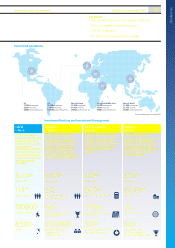
1. Global Retail and Commercial Banking
£16bn (52%)
2. Investment Banking and
Investment Management
£15bn (48%)
Contribution to Group total income
£m
Global Retail and Commercial
Banking comprised:
– UK Retail Banking
– Barclays Commercial Bank
– Barclaycard
– GRCB – Western Europe
– GRCB – Emerging Markets
– GRCB – Absa
Investment Banking and
Investment Management
comprised:
– Barclays Capital
– Barclays Global Investors
– Barclays Wealth
Income statement highlights – Group total
For the year ended 31st December 2009 2008
Continuing Discontinued Total Total
£m £m £m £m
Total income net of insurance claims 29,123 1,863 30,986 23,115
Impairment charges and other credit provisions (8,071) – (8,071) (5,419)
Operating expenses (16,715) (1,137) (17,852) (14,366)
Gain on sale of Barclays Global Investors – 6,331 6,331 –
Profit before tax 4,585 7,057 11,642 6,077
Profit attributable to equity holders of the Parent 2,628 6,765 9,393 4,382
Basic earnings per share 86.2p 59.3p
Dividend per ordinary share 2.5p 11.5p
Return on average shareholders’ equity 23.8% 16.5%
Cost:income ratio 58% 62%
Core Tier 1 ratio 10.0% 5.6%