Bank of Montreal 2003 Annual Report Download - page 8
Download and view the complete annual report
Please find page 8 of the 2003 Bank of Montreal annual report below. You can navigate through the pages in the report by either clicking on the pages listed below, or by using the keyword search tool below to find specific information within the annual report.-
 1
1 -
 2
2 -
 3
3 -
 4
4 -
 5
5 -
 6
6 -
 7
7 -
 8
8 -
 9
9 -
 10
10 -
 11
11 -
 12
12 -
 13
13 -
 14
14 -
 15
15 -
 16
16 -
 17
17 -
 18
18 -
 19
19 -
20
-
21
-
22
-
23
-
24
-
25
-
26
-
27
-
28
-
29
-
30
-
31
-
32
-
33
-
34
-
35
-
36
-
37
-
38
-
39
-
40
-
41
-
42
-
43
-
44
-
45
-
46
-
47
-
48
-
49
-
50
-
51
-
52
-
53
-
54
-
55
-
56
-
57
-
58
-
59
-
60
-
61
-
62
-
63
-
64
-
65
-
66
-
67
-
68
-
69
-
70
-
71
-
72
-
73
-
74
-
75
-
76
-
77
-
78
-
79
-
80
-
81
-
82
-
83
-
84
-
85
-
86
-
87
-
88
-
89
-
90
-
91
-
92
-
93
-
94
-
95
-
96
-
97
-
98
-
99
-
100
-
101
-
102
-
103
-
104
-
105
-
106
-
107
-
108
-
109
-
110
 |
 |

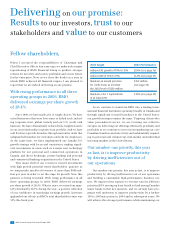
For fiscal 2003, we achieved all our financial targets. This
along with improved productivity ratios, contributed to
BMO Financial Group’s improved share price and 33% total
shareholder return. Our focus on continual productivity
improvement serves to align all resources for the maximum
benefit of our customers and, ultimately, our shareholders.
It means we spend only what is necessary to generate
increased sales, while maintaining strict controls on our cost
base. When our productivity ratios improve, we are on track to
achieve the optimum balance between current profitability
and future growth.
In 2003, all operating groups improved their cash produc
-
tivity ratio by more than 150 basis points on revenue growth
of 5% and an increase in expenses of just 1%.
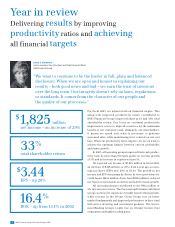
We reported net income of $1,825 million in fiscal 2003,
an increase of $408 million, or 29%, from a year ago, as earn-
ings per share (EPS) rose 28% to $3.44. The growth in net
income and EPS was primarily driven by lower provisions for
credit losses ($455 million, down from $820 million), reduced
net losses on investment securities and solid revenue growth.
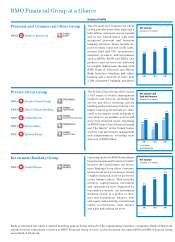
All operating groups contributed to the $412 million or
5% increase in revenue. The Personal and Commercial Client
Group continued to experience broadly based volume growth,
while revenue in the Private Client Group rose onbetter
market fundamentals and improved performance in direct and
full-service investing and investment products. The Invest-
ment Banking Group’s results rose on stronger income trust
origination and higher trading gains.
BMO Financial Group 186th Annual Report 2003
4
Year in review
Delivering results by improving
productivity ratios and achieving
all financial targets
$1,825 million
net income – an increase of 29%
33%
total shareholder return
$3.44
EPS – up 28%
16.4%
ROE – up from 13.4% in 2002
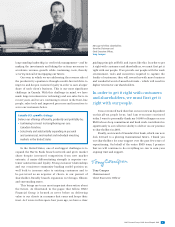
“We want to continue to be the leader in full, plain and balanced
disclosure. When we are open and honest in explaining our
results – both good news and bad – we earn the trust of investors
over the long term. Our integrity doesn’t rely on laws, regulations
or standards. It comes from the character of our people and
the quality of our processes.”
Karen E. Maidment
Senior Executive Vice-President and Chief Financial Officer
BMO Financial Group