Bank of Montreal 2003 Annual Report Download - page 18
Download and view the complete annual report
Please find page 18 of the 2003 Bank of Montreal annual report below. You can navigate through the pages in the report by either clicking on the pages listed below, or by using the keyword search tool below to find specific information within the annual report.-
 1
1 -
2
-
3
-
4
-
5
-
6
-
7
-
 8
8 -
 9
9 -
 10
10 -
 11
11 -
 12
12 -
 13
13 -
 14
14 -
 15
15 -
 16
16 -
 17
17 -
 18
18 -
 19
19 -
 20
20 -
 21
21 -
 22
22 -
 23
23 -
 24
24 -
 25
25 -
 26
26 -
 27
27 -
 28
28 -
29
-
30
-
31
-
32
-
33
-
34
-
35
-
36
-
37
-
38
-
39
-
40
-
41
-
42
-
43
-
44
-
45
-
46
-
47
-
48
-
49
-
50
-
51
-
52
-
53
-
54
-
55
-
56
-
57
-
58
-
59
-
60
-
61
-
62
-
63
-
64
-
65
-
66
-
67
-
68
-
69
-
70
-
71
-
72
-
73
-
74
-
75
-
76
-
77
-
78
-
79
-
80
-
81
-
82
-
83
-
84
-
85
-
86
-
87
-
88
-
89
-
90
-
91
-
92
-
93
-
94
-
95
-
96
-
97
-
98
-
99
-
100
-
101
-
102
-
103
-
104
-
105
-
106
-
107
-
108
-
109
-
110
 |
 |

BMO Financial Group 186th Annual Report 200314
Governing Objective
To maximize the total return to BMO shareholders and generate,
over time, first-quartile total shareholder return relative to our
Canadian and North American peer groups.
Medium-Term Financial Performance and Condition Objectives
To grow EPS by a minimumof 10%peryearover time;toincrease
ROE to between 18% and 19% over time; and to maintain a strong
regulatory capital position, consistent with our peers.
Financial Performance Objectives, Targets and Measures
BMO has established an overall governing objective and medium-
term financial performance and condition objectives, which
are outlined at the top of the page. BMO also establishes annual
financial targets for certain of our performance and condition
measures, which are outlined in the table above. Our success in
achieving our overall governing objective of first-quartile total
shareholder return is dependent on achieving our minimum
medium-term financial performance and condition objectives,
and on the relative performance of our peer group.
Because annual financial targets represent checkpoints in
the achievement of our medium-term financial objectives, they
reflect economic conditions prevailing at the time and may be
higher or lower than the medium-term financial objectives in
any particular year.
Our operating philosophy is to increase revenues at higher
rates than general economic growth rates, while limiting expense
growth rates to equal to or less than revenue growth rates, over
time. We strive for efficiencies in expense management and a
balance between current profitability and the need to invest for
future growth. When possible, expense efficiencies partially or
totally fund the costs of investing for the future. However, the
relationship between revenues and expenses in any year is
affected by economic conditions.
Our targets for 2004 were established in the context of our
expectations for the economy in the year ahead, as detailed on
page 19.
Much of the performance analysis in the MD&A occurs in
the context of the primary measures BMO management uses
to assess performance. The 11 primary measures are outlined
in the Financial Performance and Condition at a Glance sec-
tion on pages 10 and 11. Four of these measures are categorized
as our value measures: Total Shareholder Return, Earnings
per Share Growth, Return on Equity and Net Economic Profit
Growth. These value measures, which are reviewed on pages 15
to 17, are those that measure shareholder return or most directly
influence shareholder return.
The remaining seven primary measures are reviewed in the
Financial Performance Review, starting on page 20, and in
the Financial Condition Review, starting on page 41, and form the
basis of our review of the consolidated financial statements.
Pages 20 and 21 of the Financial Performance Review discuss
non-GAAP measures, foreign exchange and acquired businesses,
which are important factors influencing much of the results dis-
cussion in the MD&A.
Achievement of Targets in Prior Years
In 2002, we achieved three of our four financial targets; the
provision for credit losses was higher than our target because of
the difficult credit environment. In 2001, economic conditions
were worse than anticipated when performance targets for
the year were established. In 2001, we achieved three of our
nine financial targets, as expense growth outstripped revenue
growth and provisions for credit losses increased significantly.
Financial Objectives, Targets and Measures
(1) All EPS figures in this MD&A refer to diluted EPS, unless indicated otherwise.
(2) In 2002, we followed a practice of reporting results and establishing targets on a basis excluding amounts categorized as non-recurring. We discontinued this practice in 2003, as explained on page 20.
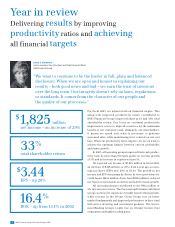
BMO’s EPS in 2002 was $2.68 but, excluding $62 million ($39 million after tax) of acquisition-related costs that were designated as non-recurring items in 2002, EPS was $2.76. Our 2003 EPS growth
target was set in relation to EPS of $2.76 in 2002. EPS of $3.44 in 2003 increased 24.6% from 2002 EPS of $2.76, excluding non-recurring items. Excluding the impact of the acquisition-related costs in
2002, BMO’s cash productivity ratio of 64.5% in 2003 improved by 190 bps and the ratio of each operating group improved by more than 150 bps.
(3)
Improved cash productivity ratio was not originally designated as a 2003 financial target. It was added as a priority focus in the first quarter of 2003. It is a non-GAAP measure and is explained on page 20.
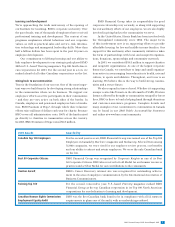
2003 Financial Targets
▪10% to 15% EPS1, 2 growth
▪ROE of 14% to 15%
▪Provision for credit losses
of $820 million or less
▪Tier 1 Capital Ratio
of at least 8%
▪Improve cash productivity
ratio of each operating
group by 150 to 200 bps2, 3
2003 Financial Performance
▪EPS2growth of 28.4%
▪ROE of 16.4%
▪
Provision for credit losses
of $455 million
▪
Tier 1 Capital Ratio
of 9.55%
▪
All groups improved
more than 150 bps and
BMO improved
2
260 bps
2004 Financial Targets
▪10% to 15% EPS growth
▪
ROE of 16% to 18%
▪
Provision for credit losses
of $500 million or less
▪
Tier 1 Capital Ratio
of at least 8%
▪Improve cash productivity
ratio by 150 bps to
200 bps
Target Met
✔
✔
✔
✔
✔