Bank of Montreal 2003 Annual Report Download - page 19
Download and view the complete annual report
Please find page 19 of the 2003 Bank of Montreal annual report below. You can navigate through the pages in the report by either clicking on the pages listed below, or by using the keyword search tool below to find specific information within the annual report.-
 1
1 -
2
-
3
-
4
-
5
-
6
-
7
-
8
-
 9
9 -
 10
10 -
 11
11 -
 12
12 -
 13
13 -
 14
14 -
 15
15 -
 16
16 -
 17
17 -
 18
18 -
 19
19 -
 20
20 -
 21
21 -
 22
22 -
 23
23 -
 24
24 -
 25
25 -
 26
26 -
 27
27 -
 28
28 -
 29
29 -
30
-
31
-
32
-
33
-
34
-
35
-
36
-
37
-
38
-
39
-
40
-
41
-
42
-
43
-
44
-
45
-
46
-
47
-
48
-
49
-
50
-
51
-
52
-
53
-
54
-
55
-
56
-
57
-
58
-
59
-
60
-
61
-
62
-
63
-
64
-
65
-
66
-
67
-
68
-
69
-
70
-
71
-
72
-
73
-
74
-
75
-
76
-
77
-
78
-
79
-
80
-
81
-
82
-
83
-
84
-
85
-
86
-
87
-
88
-
89
-
90
-
91
-
92
-
93
-
94
-
95
-
96
-
97
-
98
-
99
-
100
-
101
-
102
-
103
-
104
-
105
-
106
-
107
-
108
-
109
-
110
 |
 |

BMO Financial Group 186th Annual Report 2003 15
Value Measures
BMO’s governing objective is to maximize the total return to
shareholders and generate, over time, first-quartile total share-
holder return (TSR) relative to our Canadian and North American
peer groups.
The five-year average annual TSR is a primary measure of
shareholder value and is the most important of our financial per-
formance and condition measures since it assesses our success
in achieving our governing objective of maximizing return to
shareholders. Over the past five years, shareholders have earned
an average annual TSR of 12.9% on their investment in BMO’s
common shares. This compares favourably with an average
annual return for the TSX Composite Total Return Index of 6.3%
over the same period and was in line with the return for the
TSX Financial Services Total Return Index. Dividends paid over
the period and appreciation in BMO’s share price are outlined
in the table below. An investment of $1,000 in Bank of Montreal
common shares at the beginning of fiscal 1999 would have been
worth $1,832 at October 31, 2003, assuming reinvestment of
dividends, for a total return of 83%. Dividends declared over the
five years have increased at an average annual rate of 8.8%. In
2003, the stated quarterly dividend was raised twice, increasing
16.7% from the fourth quarter of 2002.
The average annual TSR of 12.9% for this most recent five-
year period was up appreciably from the 7.9% average annual
return for the five years ended October 31, 2002. The averages
are affected by the yearly TSRs included in the calculations.
The improvement reflected the removal of the 6.4% yearly
return earned in 1998 from the averaging calculation and its
replacement with the 33.4%returnearnedthis year.
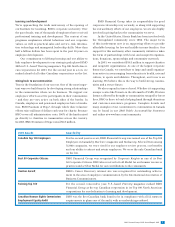
The five-year average annual total shareholder return (TSR) represents
the average annual total return earned on an investment in BMO common
shares made at the beginning of a five-year period. The return includes
the change in share price and assumes that dividends received were
reinvested in additional common shares. The one-year TSR also assumes
that dividends were reinvested in shares.
(0.9)
6.3
13.1 12.9
BMO
common
shares*
TSX
Financial
Services
Index*
TSX
Composite
Index*
S&P 500
Index*
Five-Year Average Annual
Total Shareholder Return (%)
*Total return
18.6
26.8
36.1 33.4
BMO
common
shares*
TSX
Financial
Services
Index*
TSX
Composite
Index*
S&P 500
Index*
One-Year Total
Shareholder Return (%)
*Total return
Total Shareholder Return
For the year ended October 31 2003 2002 2001 2000 1999 1998
Closing market price per common share ($) 49.33 38.10 33.86 35.25 28.33 31.55
Dividends paid per common share ($) 1.29 1.18 1.09 0.99 0.93 0.88
Dividends paid (%) 3.4 3.5 3.1 3.5 2.9 2.9
Increase (decrease) in share price (%) 29.5 12.5 (3.9) 24.4 (11.4) 3.7
Total annual shareholder return (%) 33.4 16.2 (1.2) 29.0 (7.4) 6.4
Total annual shareholder return assumes reinvestment of quarterly dividends and therefore does not equal the sum of dividend and share price returns in the table.
Total Shareholder Return
Highlights
▪
BMO investors have earned an average annual return of 12.9% over the
past five years and earned 33.4% in 2003.
▪
We surpassed all our performance targets in 2003.
▪
EPS increased 28% from a year ago.
▪
BMO is the only major bank in North America to earn an ROE of more
than 13% for 14 consecutive years.
▪
ROE of 16.4% rose from 13.4% in 2002.
▪
The stated quarterly dividend rate increased 16.7% from a year ago.
The 33.4% TSR earned in fiscal 2003 compared favourably
with the 26.8% return of the TSX Composite Total Return Index.
Our one-year TSR was slightly below the TSX Financial Services
Total Return Index, but BMO common shares had outperformed
that index by 18.3 percentage points in 2002.
Pages 10 and 12 provide further comment on shareholder
return and include peer group comparisons.