Bank of Montreal 2003 Annual Report Download - page 14
Download and view the complete annual report
Please find page 14 of the 2003 Bank of Montreal annual report below. You can navigate through the pages in the report by either clicking on the pages listed below, or by using the keyword search tool below to find specific information within the annual report.-
 1
1 -
2
-
3
-
 4
4 -
 5
5 -
 6
6 -
 7
7 -
 8
8 -
 9
9 -
 10
10 -
 11
11 -
 12
12 -
 13
13 -
 14
14 -
 15
15 -
 16
16 -
 17
17 -
 18
18 -
 19
19 -
 20
20 -
 21
21 -
 22
22 -
 23
23 -
 24
24 -
25
-
26
-
27
-
28
-
29
-
30
-
31
-
32
-
33
-
34
-
35
-
36
-
37
-
38
-
39
-
40
-
41
-
42
-
43
-
44
-
45
-
46
-
47
-
48
-
49
-
50
-
51
-
52
-
53
-
54
-
55
-
56
-
57
-
58
-
59
-
60
-
61
-
62
-
63
-
64
-
65
-
66
-
67
-
68
-
69
-
70
-
71
-
72
-
73
-
74
-
75
-
76
-
77
-
78
-
79
-
80
-
81
-
82
-
83
-
84
-
85
-
86
-
87
-
88
-
89
-
90
-
91
-
92
-
93
-
94
-
95
-
96
-
97
-
98
-
99
-
100
-
101
-
102
-
103
-
104
-
105
-
106
-
107
-
108
-
109
-
110
 |
 |

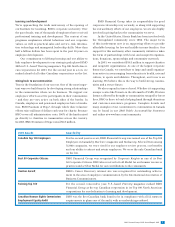
BMO Financial Group 186th Annual Report 200310
Net Economic Profit (NEP) Growth
▪
NEP, a measure of economic value added, rose 92% to
$703 million, after declining in 2002.
▪Personal and Commercial Client Group accounted for approx-
imately three-quarters of our NEP. Investment Banking Group
accounted for approximately 50% of NEP growth.
Total Shareholder Return (TSR)
▪BMO’s average five-year TSR of 12.9% improved from 7.9% a
year ago and was better than the TSX and S&P Composite
Indices and in line with the TSX Financial Services Index.
▪BMO’s 33.4% one-year TSR was better than the TSX and S&P
Indices, but was slightly below the TSX Financial Services
Index, which we outperformed by 18 percentage points in 2002.
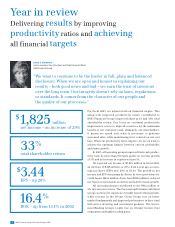
Return on Equity (ROE)
▪ROE was 16.4%, up from 13.4% in 2002, and above our 2003
target of 14% to 15%.
▪BMO has generated ROE of more than 13% in each of the past
14 years, and is the only major North American bank to meet
this test of earnings consistency.
Revenue Growth
▪
Revenue increased $412 million or 5% in 2003 and improved in
each of our client operating groups.
▪
The weaker U.S. dollar lowered revenue growth in 2003 by
3 percentage points, while the incremental effect of acquired
businesses increased revenue growth by 1.4 percentage points.
Earnings per Share (EPS) Growth
▪
EPS rose 28% to a record $3.44 after growing 1% a year ago.
Growth was driven by a lower provision for credit losses,
business growth in all operating groups and lower net losses
on investment securities.
▪
EPS growth of 28% exceeded our 2003 target of 10% to 15%
growth.
Expense-to-Revenue Ratio (a)
(or Productivity Ratio)
▪The productivity ratio improved 240 basis points to 65.7%
in 2003.
▪
Each of our client operating groups improved their cash produc
-
tivityratiosbymorethan150basispointsandincreasedrevenues
more than expenses, in both absolute and percentage terms.
*
Adjustments to GAAP results to derive cash and other non-GAAP results and measures,
including adjusting revenue to a taxable equivalent basis (teb),
are outlined on page 20.
(a)
For consistency with our peer groups, the non-interest expense-to-revenue ratios for BMO
and the peer groups reflected in the graphs for 1999 to 2001 include goodwill amortization.
See page 12 for further comments on peer group
comparisons.
Our Performance*Peer Group Comparison*
BMO Financial Group
Canadian peer group average
North American peer group average
Further details are provided on page 15.
Further details are provided on page 16.
Further details are provided on page 17.
Further details are provided on page 17.
Further details are provided on page 22.
Further details are provided on page 25.
Net Economic Profit (NEP)
Growth (%)
▪
NEP growth of 92% in 2003 was above
the North American peer group average
of 45% but below the Canadian peer
group average.
▪
The Canadian peer group average growth
rate was almost 3,000% because two
members of the peer group had net
economic losses in 2002.
Five-Year Total Shareholder
Return (TSR) (%)
▪
BMO’s average five-year TSR of 12.9%
was above the North American peer
group average of 9.6% but below the
Canadian peer group average of 16.3%.
▪
More recent relative performance is
better, as BMO’s average two-year TSR
and three-year TSR were both third best
of the six-bank Canadian peer group.
Earnings per Share (EPS) Growth (%)
▪BMO’s EPS growth of 28.4% in 2003 was
above the 17-bank North American peer
group average of 14.0% but below the
Canadian peer group average of 64.9%.
▪
The Canadian peer group average growth
rate was unusually high, as some mem-
bers of our peer group had weak earnings
in 2002.
Return on Equity (ROE) (%)
▪
ROE of 16.4% in 2003 was above the
Canadian peer group average of 15.8%
and equal to the North American peer
group average.
Revenue Growth (%)
▪
Revenue growth of 4.7% in 2003 was
above the Canadian peer group average
of 1.2% and the North American peer
group average of negative 1.9%.
▪
BMO’s revenue growth was above the
Canadian peer group average for the
first time since 1995.
Expense-to-Revenue Ratio (%)
▪
BMO’s productivity ratio of 65.7% was
better than the Canadian peer group
average of 67.3% but above the North
American peer group average of 60.0%.
▪Improving productivity was BMO’s top
priority in 2003.
Financial Performance and Condition at a Glance
20032002200120001999
12.9
7.9
14.3
22.9
22.0
20032002200120001999
28
1
(18)
39
2
20032002200120001999
16.4
13.4
13.8
18.0
14.1
20032002200120001999
92
(15)
(43)
90
(14)
20032002200120001999
5
0
2
9
9
20032002200120001999
65.7
68.1
64.7
61.3
67.3