Bank of Montreal 2003 Annual Report Download - page 15
Download and view the complete annual report
Please find page 15 of the 2003 Bank of Montreal annual report below. You can navigate through the pages in the report by either clicking on the pages listed below, or by using the keyword search tool below to find specific information within the annual report.-
 1
1 -
2
-
3
-
4
-
 5
5 -
 6
6 -
 7
7 -
 8
8 -
 9
9 -
 10
10 -
 11
11 -
 12
12 -
 13
13 -
 14
14 -
 15
15 -
 16
16 -
 17
17 -
 18
18 -
 19
19 -
 20
20 -
 21
21 -
 22
22 -
 23
23 -
 24
24 -
 25
25 -
26
-
27
-
28
-
29
-
30
-
31
-
32
-
33
-
34
-
35
-
36
-
37
-
38
-
39
-
40
-
41
-
42
-
43
-
44
-
45
-
46
-
47
-
48
-
49
-
50
-
51
-
52
-
53
-
54
-
55
-
56
-
57
-
58
-
59
-
60
-
61
-
62
-
63
-
64
-
65
-
66
-
67
-
68
-
69
-
70
-
71
-
72
-
73
-
74
-
75
-
76
-
77
-
78
-
79
-
80
-
81
-
82
-
83
-
84
-
85
-
86
-
87
-
88
-
89
-
90
-
91
-
92
-
93
-
94
-
95
-
96
-
97
-
98
-
99
-
100
-
101
-
102
-
103
-
104
-
105
-
106
-
107
-
108
-
109
-
110
 |
 |

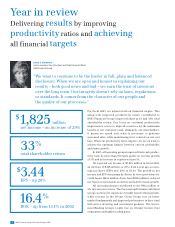
BMO Financial Group 186th Annual Report 2003 11
Credit Risk
▪The provision for credit losses was $455 million or 30 basis
points of average net loans and acceptances, down from
$820 million or 56 basis points in 2002.
▪The provision in 2003 was significantly lower than our 2003
target provision of $820 million or less.
Cash and Securities-to-Total Assets
▪
The cash and securities-to-total assets ratio increased to
29.1% from 24.9% in 2002 due to higher trading securities
positions.
▪Liquidity remains sound and continues to be supported by
broad diversification of deposits.
Capital Adequacy
▪The Tier 1 Capital Ratio was 9.55%, up from 8.80% last year.
▪The Total Capital Ratio was 12.09%, down from 12.23% in
2002, as we chose to redeem two subordinated debt issues
to optimize our capital level.
Credit Rating (Standard & Poor’s)
▪Our credit rating, as measured by Standard & Poor’s®5(S&P)
senior debt ratings, remained at AA–, the best of Canada’s
major banks, together with one of our
competitors.
▪S&P upgraded its ratings outlook on BMO to stable from
negative in the fourth quarter of 2003.
Credit Rating (Moody’s)
▪
Our credit rating, as measured by Moody’s
®
6senior debt
ratings, remained at Aa3, slightly below the highest-rated
Canadian bank and consistent with the highest of the
remaining major Canadian banks.
▪Moody’s upgraded its ratings outlook on BMO to stable from
negative in the second quarter of 2003.
Impaired Loans
▪Gross impaired loans and acceptances were $1,918 million,
compared with $2,337 million in 2002, and represented
12.2% of equity and allowances for credit losses, versus
15.2% a year ago.
▪
Impaired loans and acceptances formations were $1,303 mil
-
lion, down from $1,945 million in 2002.
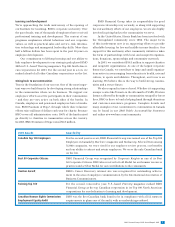
Our Performance Peer Group Comparison
BMO Financial Group
Canadian peer group average
North American peer group average
Further details are provided on pages 24 and 47.
Further details are provided on page 24 and 47.
Further details are provided on page 50.
Further details are provided on page 43.
Further details are provided on page 43.
Further details are provided on page 43.
Provision for Credit Losses as a % of
Average Net Loans and Acceptances
▪BMO’s provision for credit losses of 0.30%
of average net loans and acceptances
was better than the Canadian peer group
average of 0.39% and the North American
peer group average of 0.95%.
▪
BMO’s credit loss experience remains
top-tier.
Gross Impaired Loans and
Acceptances as a % of Equity and
Allowances for Credit Losses
▪
BMO’s ratio was higher than the Canadian
peer group average of 11.4% and the North
American peer group average of 7.6%.
Cash and Securities-to-Total
Assets (%)
▪
BMO’s ratio of 29.1% was below the Cana-
dian peer group average of 31.4% and
the
North American peer group average
of 38.2%.
▪
Our ratio remains higher than our mini-
mum target ratio.
Tier 1 Capital Ratio (%)
▪
Our Tier 1 Capital Ratio of 9.55% was
below the Canadian peer group average
of 10.20% but above our minimum target
of 8%.
▪
On a U.S. basis, our Tier 1 Capital Ratio was
9.17%, above the North American peer
group average of 8.75%.
Credit Rating
▪
BMO’s credit rating of AA–, as measured by
S&P’s senior debt ratings, was better than
the Canadian peer group average and the
North American peer group average of A+.
Credit Rating
▪
BMO’s credit rating of Aa3, as measured by
Moody’s senior debt ratings, was compa-
rable to the Canadian and North American
peer group averages.
See page 12 for further comments on peer group
comparisons.
20032002200120001999
0.30
0.56
0.66
0.25
0.22
20032002200120001999
12.2
15.2
14.2
10.5
8.5
20032002200120001999
29.1
24.9
23.1
27.8
29.2
20032002200120001999
9.55
8.80
8.15
8.83
7.72
AA– AA– AA– AA– AA–
AA–
A+A+ A+ A+
A+
20032002200120001999
Aa3 Aa3 Aa3 Aa3 Aa3
Aa3 Aa3Aa3 Aa3 Aa3
20032002200120001999