Baker Hughes 2007 Annual Report Download - page 6
Download and view the complete annual report
Please find page 6 of the 2007 Baker Hughes annual report below. You can navigate through the pages in the report by either clicking on the pages listed below, or by using the keyword search tool below to find specific information within the annual report.-
 1
1 -
 2
2 -
 3
3 -
 4
4 -
 5
5 -
 6
6 -
 7
7 -
 8
8 -
 9
9 -
 10
10 -
 11
11 -
 12
12 -
 13
13 -
 14
14 -
 15
15 -
 16
16 -
 17
17 -
18
-
19
-
20
-
21
-
22
-
23
-
24
-
25
-
26
-
27
-
28
-
29
-
30
-
31
-
32
-
33
-
34
-
35
-
36
-
37
-
38
-
39
-
40
-
41
-
42
-
43
-
44
-
45
-
46
-
47
-
48
-
49
-
50
-
51
-
52
-
53
-
54
-
55
-
56
-
57
-
58
-
59
-
60
-
61
-
62
-
63
-
64
-
65
-
66
-
67
-
68
-
69
-
70
-
71
-
72
-
73
-
74
-
75
-
76
-
77
-
78
-
79
-
80
-
81
-
82
-
83
-
84
-
85
-
86
-
87
-
88
-
89
-
90
-
91
-
92
-
93
-
94
-
95
-
96
-
97
-
98
-
99
-
100
-
101
-
102
-
103
-
104
-
105
-
106
-
107
-
108
-
109
-
110
-
111
-
112
-
113
-
114
-
115
-
116
-
117
-
118
-
119
-
120
-
121
-
122
-
123
-
124
-
125
-
126
-
127
-
128
-
129
-
130
-
131
-
132
-
133
-
134
-
135
-
136
-
137
-
138
-
139
-
140
-
141
-
142
-
143
-
144
-
145
-
146
-
147
-
148
-
149
-
150
-
151
-
152
-
153
-
154
-
155
-
156
-
157
-
158
-
159
-
160
-
161
-
162
-
163
 |
 |

To Our Stockholders
In the fourth year of the current growth
cycle, Baker Hughes achieved record reve-
nues, exceeding $10 billion for the first time,
while also earning its highest annual operat-
ing profit. We are pleased with the progress
we have made in growing our business in key
geographic markets, particularly in the East-
ern Hemisphere, which contributed $879 mil-
lion in incremental revenue during the year.
At the same time, market growth in North
America slowed as natural gas inventories
reached record high levels and changes in
the Canadian royalty structure discouraged
drilling activity.
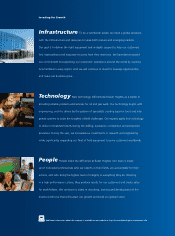
In 2008, we will continue to grow glob-
ally. To drive growth in 2007, we invested in
infrastructure at our technology centers and
in operations facilities in emerging markets;
in technology, through increased Research &
Engineering spending and capital expendi-
tures for rental equipment; and in people, both
through recruiting and development programs.
We also understand the need to optimize
our organization for improved profitability in
an increasingly competitive market.
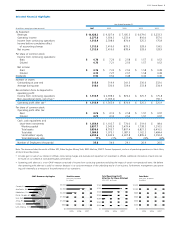
Record Financial Results
Baker Hughes had revenues of $10.4 billion
in 2007, up from $9.03 billion in 2006. Our
operating profit was $1.514 billion or $4.73 per
diluted share, compared to $1.363 billion or
$4.10 per diluted share in 2006.
For the full year in 2007, the company’s
net income was $1.514 billion or $4.73 per
diluted share, compared to $2.419 billion
or $7.27 per diluted share in 2006, which
included a $1.035 billion after tax gain from
the sale of our 30% interest in the Western
Geco seismic business to Schlumberger Ltd.
Capital investment of $1.127 billion in
2007 was up 22% from $922 million in 2006.
Of the total investment, 49% was devoted
to rental tools and equipment in global oper-
ations, 12% was used to build new facilities
as part of our worldwide expansion, and 39%
was spent on expanding engineering and
manufacturing capacity.
Baker Hughes also repurchased 6.4 mil-
lion shares of common stock in 2007, at
an average price of $81.25, for a total of
$521.5 million. At the end of 2007, the
company had authorization remaining to
repurchase approximately $824.0 million
in common stock. On December 31, 2007,
Baker Hughes had 315.4 million shares out-
standing and $1.054 billion in cash and
short-term investments.
Segment Results
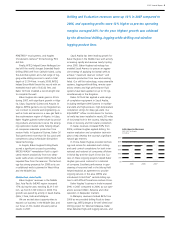
Drilling and Evaluation revenues were
$5,293 million in 2007, up 14% from
$4,661 million in 2006. Operating profits
before tax of $1,396 million in 2007 were
12% higher than the $1,242 million for
this segment in 2006. Highest growth was
achieved by the directional drilling, logging-
while-drilling and wireline logging product
lines at INTEQ and formation evaluation prod-
uct line at Baker Atlas. Drilling and Evaluation
segment pre-tax operating margin was 26%
for 2007 and 27% in 2006.
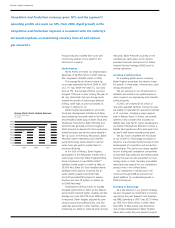
Completion and Production revenues
grew by 18% to $5,135 million in 2007 from
$4,367 million in 2006. The segment’s oper-
ating profits in 2007 were $1,112 million, up
18% from $942 million in 2006. The pre-tax
operating margin for both 2007 and 2006
was 22%. Growth in the Completion and
Production segment is consistent with the
industry’s increased emphasis on maximizing
recovery from oil and natural gas reservoirs.
Our completions and electrical submersible
pump (ESP) product lines at Baker Oil Tools
and Centrilift, respectively, had the highest
growth rates, while the specialty chemical
business at Baker Petrolite also achieved
steady gains. The ProductionQuest production
optimization business unit, which was formed
in 2006, achieved solid revenue growth in 2007.
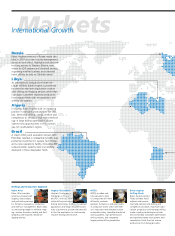
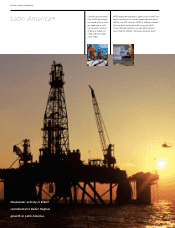
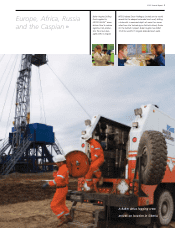
Regional Performance
In 2007, Baker Hughes continued to
implement our strategy of increasing our
presence and growing our business in key
countries where the long-term growth poten-
tial is the highest. In 2005, we organized our
operations into four geographic regions to
Chad C. Deaton
2 Baker Hughes Incorporated