Baker Hughes 2007 Annual Report Download - page 5
Download and view the complete annual report
Please find page 5 of the 2007 Baker Hughes annual report below. You can navigate through the pages in the report by either clicking on the pages listed below, or by using the keyword search tool below to find specific information within the annual report.-
 1
1 -
 2
2 -
 3
3 -
 4
4 -
 5
5 -
 6
6 -
 7
7 -
 8
8 -
 9
9 -
 10
10 -
 11
11 -
 12
12 -
 13
13 -
 14
14 -
 15
15 -
 16
16 -
17
-
18
-
19
-
20
-
21
-
22
-
23
-
24
-
25
-
26
-
27
-
28
-
29
-
30
-
31
-
32
-
33
-
34
-
35
-
36
-
37
-
38
-
39
-
40
-
41
-
42
-
43
-
44
-
45
-
46
-
47
-
48
-
49
-
50
-
51
-
52
-
53
-
54
-
55
-
56
-
57
-
58
-
59
-
60
-
61
-
62
-
63
-
64
-
65
-
66
-
67
-
68
-
69
-
70
-
71
-
72
-
73
-
74
-
75
-
76
-
77
-
78
-
79
-
80
-
81
-
82
-
83
-
84
-
85
-
86
-
87
-
88
-
89
-
90
-
91
-
92
-
93
-
94
-
95
-
96
-
97
-
98
-
99
-
100
-
101
-
102
-
103
-
104
-
105
-
106
-
107
-
108
-
109
-
110
-
111
-
112
-
113
-
114
-
115
-
116
-
117
-
118
-
119
-
120
-
121
-
122
-
123
-
124
-
125
-
126
-
127
-
128
-
129
-
130
-
131
-
132
-
133
-
134
-
135
-
136
-
137
-
138
-
139
-
140
-
141
-
142
-
143
-
144
-
145
-
146
-
147
-
148
-
149
-
150
-
151
-
152
-
153
-
154
-
155
-
156
-
157
-
158
-
159
-
160
-
161
-
162
-
163
 |
 |

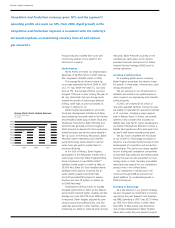
$0
$500
$1,000
$1,500
$2,000
$3,000
$2,500
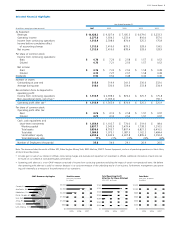
Total Revenues
2005–2007, by Quarter
(In millions)
2005 2006 2007
$1.40
$1.20
$1.00
$0.80
$0.60
$0.40
$0.20
$0
Total Operating Profit
After Tax Per Share (Diluted)
2005–2007, by Quarter
2005 2006 2007
Total Debt
2005–2007, by Quarter
(In millions)
$1,200
$1,000
$800
$600
$400
$200
$0
2005 2006 2007
2007 Revenues by Region
Canada, 5%
Asia Pacific, 9%
Middle East, 10%
Russia, Caspian, 6%
USA, 36%
Africa, 9%
Europe, 15%
Latin America, 10%
Year Ended December 31,
(In millions, except per share amounts) 2007 2006 2005 2004 2003
As Reported:
Revenues $ 10,428.2 $ 9,027.4 $ 7,185.5 $ 6,079.6 $ 5,233.3
Operating income 2,277.8 1,934.3 1,233.4 816.4 557.0
Income from continuing operations 1,513.9 2,398.6 874.4 525.3 175.8
Income before cumulative effect
of accounting change 1,513.9 2,419.0 879.3 528.6 134.5
Net income 1,513.9 2,419.0 878.4 528.6 128.9
Per share of common stock:
Income from continuing operations:
Basic $ 4.76 $ 7.26 $ 2.58 $ 1.57 $ 0.52
Diluted 4.73 7.21 2.56 1.57 0.52
Net income:
Basic $ 4.76 $ 7.32 $ 2.59 $ 1.58 $ 0.38
Diluted 4.73 7.27 2.57 1.58 0.38
Dividends 0.52 0.52 0.48 0.46 0.46
Number of shares:
Outstanding at year end 315.4 319.9 341.5 336.6 332.0
Average during year 318.0 330.6 339.4 333.8 334.9
Reconciliation from As Reported to
operating profit:
Income from continuing operations $ 1,513.9 $ 2,398.6 $ 874.4 $ 525.3 $ 175.8
Non-operational items, net of tax(1) – (1,035.2) – – 150.1
Operating profit after tax(2) $ 1,513.9 $ 1,363.4 $ 874.4 $ 525.3 $ 325.9
Per share of common stock:
Operating profit after tax:
Basic $ 4.76 $ 4.12 $ 2.58 $ 1.57 $ 0.97
Diluted 4.73 4.10 2.56 1.57 0.97
Cash, cash equivalents and
short-term investments $ 1,054.4 $ 1,103.7 $ 774.0 $ 319.0 $ 98.4
Working capital 3,837.7 3,345.9 2,479.4 1,738.3 1,210.5
Total assets 9,856.6 8,705.7 7,807.4 6,821.3 6,416.5
Total debt 1,084.8 1,075.1 1,087.9 1,162.3 1,484.4
Stockholders’ equity 6,305.6 5,242.9 4,697.8 3,895.4 3,350.4
Total debt/equity ratio 17% 21% 23% 30% 44%
Number of Employees (thousands) 35.8 34.6 29.1 26.9 26.5
Note: The above excludes the results of Baker SPD, Baker Hughes Mining Tools, BIRD Machine, EIMCO Process Equipment, and our oil producing operations in West Africa,
all discontinued businesses.
(1) Includes gain on sale of our interest in affiliate, restructuring charges and reversals and impairment of investment in affiliate. Additional information of each item can
be found on our website at www.bakerhughes.com/investor.
(2) Operating profit after tax is a non-GAAP measure comprised of income from continuing operations excluding the impact of certain non-operational items. We believe
that operating profit after tax is useful to investors because it is a consistent measure of the underlying results of our business. Furthermore, management uses operat-
ing profit internally as a measure of the performance of our operations.
Selected Financial Highlights
2007 Annual Report 1