BP 2005 Annual Report Download - page 78
Download and view the complete annual report
Please find page 78 of the 2005 BP annual report below. You can navigate through the pages in the report by either clicking on the pages listed below, or by using the keyword search tool below to find specific information within the annual report.-
 1
1 -
2
-
3
-
4
-
5
-
6
-
7
-
8
-
9
-
10
-
11
-
12
-
13
-
14
-
15
-
16
-
17
-
18
-
19
-
20
-
21
-
22
-
23
-
24
-
25
-
26
-
27
-
28
-
29
-
30
-
31
-
32
-
33
-
34
-
35
-
36
-
37
-
38
-
39
-
40
-
41
-
42
-
43
-
44
-
45
-
46
-
47
-
48
-
49
-
50
-
51
-
52
-
53
-
54
-
55
-
56
-
57
-
58
-
59
-
60
-
61
-
62
-
63
-
64
-
65
-
66
-
67
-
 68
68 -
 69
69 -
 70
70 -
 71
71 -
 72
72 -
 73
73 -
 74
74 -
 75
75 -
 76
76 -
 77
77 -
 78
78 -
 79
79 -
 80
80 -
 81
81 -
 82
82 -
 83
83 -
 84
84 -
 85
85 -
 86
86 -
 87
87 -
 88
88 -
89
-
90
-
91
-
92
-
93
-
94
-
95
-
96
-
97
-
98
-
99
-
100
-
101
-
102
-
103
-
104
-
105
-
106
-
107
-
108
-
109
-
110
-
111
-
112
-
113
-
114
-
115
-
116
-
117
-
118
-
119
-
120
-
121
-
122
-
123
-
124
-
125
-
126
-
127
-
128
-
129
-
130
-
131
-
132
-
133
-
134
-
135
-
136
-
137
-
138
-
139
-
140
-
141
-
142
-
143
-
144
-
145
-
146
-
147
-
148
-
149
-
150
-
151
-
152
-
153
-
154
-
155
-
156
-
157
-
158
-
159
-
160
-
161
-
162
-
163
-
164
-
165
-
166
-
167
-
168
-
169
-
170
-
171
-
172
-
173
-
174
-
175
-
176
-
177
-
178
-
179
-
180
 |
 |

76 Making energy more
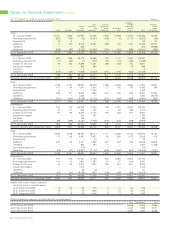
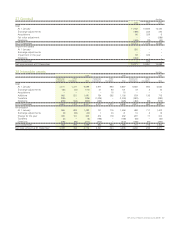
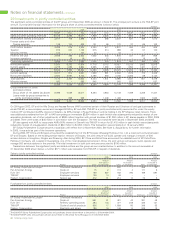
Notes on financial statements continued
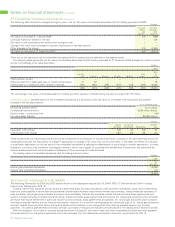
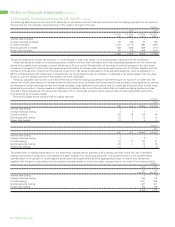
35 Derivative financial instruments continued
Market risk exposure The group measures its market risk exposure, i.e. potential gain or loss in fair values, on its held-for-trading activity using
value-at-risk techniques. These techniques are based on a variance/covariance model or a Monte Carlo simulation and make a statistical
assessment of the market risk arising from possible future changes in market values over a 24-hour period. The calculation of the range of potential
changes in fair value takes into account a snapshot of the end-of-day exposures and the history of one-day price movements, together with the
correlation of these price movements. The group calculates value-at-risk for the bulk of instruments and exposures in the held-for-trading category,
other than the UK North Sea natural gas embedded derivatives, for which a sensitivity analysis is calculated.
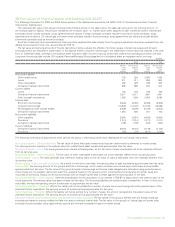
The group has previously calculated and published value-at-risk expressed to three standard deviations for the internal delegation of market risk
limits and control purposes. This is equivalent to a 99.7% confidence interval or a probability of one day per year where the daily gain or loss will
exceed the calculated value at risk if the portfolio was left unchanged. In order to improve the practical application of this tool, the group has
adopted a 95% confidence level, or calculation to 1.65 standard deviations. This has the effect of increasing the expected frequency of occasions
when the daily gain or loss may exceed the calculated value-at-risk to one per month if the portfolio is left unchanged. This provides a better
opportunity for verifying models and assumptions and improving accuracy of the value-at-risk calculation. For completeness, 2005 value-at-risk
data has been disclosed using both the 95% and 99.7% confidence levels. The value-at-risk model takes account of derivative financial instruments
types such as interest rate forward and futures contracts, swap agreements, options and swaptions; foreign exchange forward and futures
contracts, swap agreements and options, and oil, natural gas and power price futures, swap agreements and options. Financial assets and liabilities
and physical crude oil and refined products that are treated as held for trading positions are also included in these calculations. The value-at-risk
calculation for oil, natural gas and power price exposure also includes cash-settled commodity contracts such as forward contracts. For options,
a linear approximation is included in the value-at-risk models.
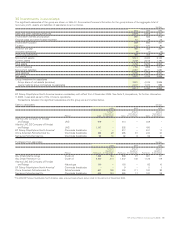
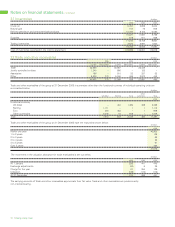
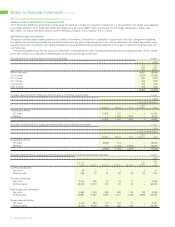
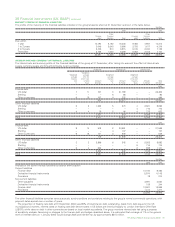
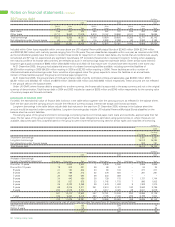
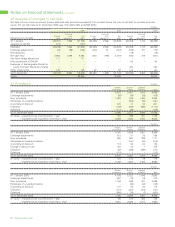
The following table shows values at risk for held for trading activities described above.
Value at risk on three standard deviations $ million
2005
High Low Average Year end
Interest rate trading 2 –––
Foreign exchange trading 9 2 4 2
Oil price trading 145 31 60 56
Natural gas price trading 71 9 26 30
Power price trading 30 4 14 16
Value at risk on 1.65 standard deviations $ million
2005
High Low Average Year end
Interest rate trading 1 –––
Foreign exchange trading 5 1 2 1
Oil price trading 80 17 33 31
Natural gas price trading 39 6 15 17
Power price trading 16 2 7 9
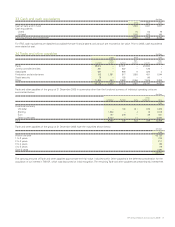
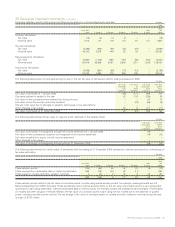
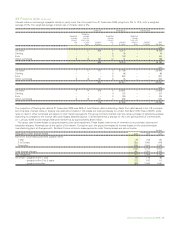
The presentation of held-for-trading results shown in the table below includes the results of the group’s trading units that involve the use of
derivatives in conjunction with physical and paper trading of oil, natural gas and power. It is considered that a more comprehensive representation
of the group’s oil, natural gas and power price trading activities is given by aggregating the gain or loss on such derivatives, together with the gain
or loss arising from the physical and paper trades to which they relate, representing the net result of the trading portfolio. Also included in the net
result of the held-for-trading portfolio are broker fees, transportation costs and trader bonuses. Held-for-trading results include the results of risk
management activity in respect of the group’s supply and marketing activities that do not qualify for hedge accounting.
$ million
2005
Net
gain (loss)
Interest rate trading 10
Foreign exchange trading 162
Oil trading 1,552
Natural gas trading 1,312
Power trading (64)
2,972
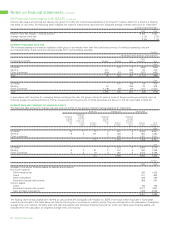
Gains and losses relating to derivative contracts presented net in the income statement are included within other operating revenues. These
contract types include futures, options, swaps and certain forward sales and purchase contracts where delivery is routinely obviated by the sale or
purchase of offsetting contracts. Also included are the gains and losses relating to the change in the fair value of all derivative contracts held at the
balance sheet dates, including derivative contracts presented gross when settled. The gain for the year presented net in the income statement was
$838 million (2004 $1,216 million and 2003 $1,081 million).