BP 2005 Annual Report Download - page 14
Download and view the complete annual report
Please find page 14 of the 2005 BP annual report below. You can navigate through the pages in the report by either clicking on the pages listed below, or by using the keyword search tool below to find specific information within the annual report.-
 1
1 -
2
-
3
-
 4
4 -
 5
5 -
 6
6 -
 7
7 -
 8
8 -
 9
9 -
 10
10 -
 11
11 -
 12
12 -
 13
13 -
 14
14 -
 15
15 -
 16
16 -
 17
17 -
 18
18 -
 19
19 -
 20
20 -
 21
21 -
 22
22 -
 23
23 -
 24
24 -
25
-
26
-
27
-
28
-
29
-
30
-
31
-
32
-
33
-
34
-
35
-
36
-
37
-
38
-
39
-
40
-
41
-
42
-
43
-
44
-
45
-
46
-
47
-
48
-
49
-
50
-
51
-
52
-
53
-
54
-
55
-
56
-
57
-
58
-
59
-
60
-
61
-
62
-
63
-
64
-
65
-
66
-
67
-
68
-
69
-
70
-
71
-
72
-
73
-
74
-
75
-
76
-
77
-
78
-
79
-
80
-
81
-
82
-
83
-
84
-
85
-
86
-
87
-
88
-
89
-
90
-
91
-
92
-
93
-
94
-
95
-
96
-
97
-
98
-
99
-
100
-
101
-
102
-
103
-
104
-
105
-
106
-
107
-
108
-
109
-
110
-
111
-
112
-
113
-
114
-
115
-
116
-
117
-
118
-
119
-
120
-
121
-
122
-
123
-
124
-
125
-
126
-
127
-
128
-
129
-
130
-
131
-
132
-
133
-
134
-
135
-
136
-
137
-
138
-
139
-
140
-
141
-
142
-
143
-
144
-
145
-
146
-
147
-
148
-
149
-
150
-
151
-
152
-
153
-
154
-
155
-
156
-
157
-
158
-
159
-
160
-
161
-
162
-
163
-
164
-
165
-
166
-
167
-
168
-
169
-
170
-
171
-
172
-
173
-
174
-
175
-
176
-
177
-
178
-
179
-
180
 |
 |

12 Making energy more
receive their dividend in the form of shares rather than
cash. The BP Direct Access Plan for US and Canadian
shareholders also includes a dividend reinvestment feature.
We remain committed to returning all free cash flows in
excess of investment and dividend needs to our shareholders.
During 2005, the company repurchased 1,060 million of its
own shares at a cost of $11,597 million. Of these, 77 million
were cancelled and the remainder are held in treasury. The
repurchased shares had a nominal value of $265 million and
represented 4.9% of the ordinary shares in issue at the
end of 2004. Since the inception of the share repurchase
programme in 2000, we have repurchased 2,662 million
shares at a cost of $25.2 billion. BP intends to continue its
programme of share buybacks, subject to market conditions
and constraints and to renewed authority at the April 2006
annual general meeting.
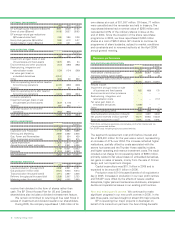
Business performance
EXPLORATION AND PRODUCTION
$ million
2005 2004 2003
Profit before interest and taxa25,508 18,087 15,084
Inventory holding (gains) losses (17) (10) (3)
Replacement cost profit before interest
and tax 25,491 18,077 15,081
Results include:
Impairment and gain (loss) on sale
of business and fixed assets 893 (469) 175
Environmental and other provisions –––
Restructuring, integration and
rationalization costs – – (117)
Fair value gain (loss) on
embedded derivatives (1,688) – –
Other (203) (27) –
Total non-operating items (998) (496) 58
Total hydrocarbon production (mboe/d) 4,014 3,997 3,606
Net proved reserves (million barrels)b18,271 18,583 18,338
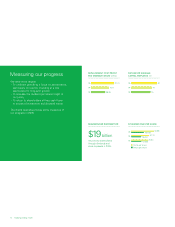
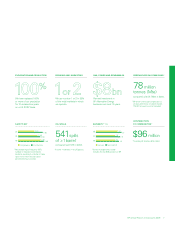
Reserves replacement ratiob100% 110% 109%
aProfit from continuing operations and includes profit after interest and tax
of equity-accounted entities.
bUK SORP basis including equity-accounted entities.
The segment’s replacement cost profit before interest and
tax of $25,491 million for the year was a record, representing
an increase of 41% over 2004. The increase reflected higher
realizations, partially offset by costs associated with the
severe hurricanes and the Thunder Horse stability incident,
and higher operating and revenue investment costs. The result
included a net charge for non-operating items of $998 million,
primarily related to fair value losses on embedded derivatives,
net gains on sales of assets, mainly from the sale of Ormen
Lange, and net impairment charges.
Capital expenditure was $10.1 billion in 2005 and is
expected to be around $11 billion in 2006.
Production was 4,014 thousand barrels of oil equivalent a
day in 2005. Increases in production in our new profit centres
and TNK-BP were offset by the effects of severe weather
disruptions, higher planned maintenance shutdowns, anticipated
decline and operational issues in our existing profit centres.
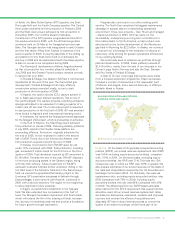
New and existing profit centres We continued to make
significant progress in our new profit centres in 2005. In the
past three years, we have brought on stream 20 major projects.
BP is operating four major projects in Azerbaijan on
behalf of its consortium partners: the Azeri-Chirag-Gunashli
EXTERNAL ENVIRONMENT
2005 2004 2003
BP average liquids realizations ($/barrel) 48.51 35.39 27.25
Brent oil price ($/barrel) 54.48 38.27 28.83
BP average natural gas realizations
($/thousand cubic feet) 4.90 3.86 3.39
Henry Hub gas price ($/mmBtu) 8.65 6.13 5.37
Global indicator margin ($/barrel) 8.60 6.31 4.08
NON-OPERATING ITEMS
$ million
2005 2004 2003
Impairment and gain (loss) on sale
of businesses and fixed assets 1,070 295 94
Environmental and other provisions (412) (489) (582)
Restructuring, integration and
rationalization costs (134) (134) (399)
Fair value gain (loss) on
embedded derivatives (2,047) – –
Other (668) 39 559
Total non-operating items before taxation
for continuing operations (2,191) (289) (328)
Taxation 717 83 94
Total non-operating items after taxation
for continuing operations (1,474) (206) (234)
Innovene operations
Impairment and gain (loss) on sale
of businesses and fixed assets (647) (1,119) –
Taxation 367 253 –
Total after taxation for Innovene
operations (280) (866) –
Total after taxation (1,754) (1,072) (234)
CAPITAL INVESTMENT
$ million
2005 2004 2003
Exploration and Production 10,149 9,654 9,398
Refining and Marketing 2,669 2,692 2,945
Gas, Power and Renewables 235 524 439
Other businesses and corporate 885 940 815
Capital expenditure 13,938 13,810 13,597
Acquisitions and asset exchanges 211 2,841 6,026
14,149 16,651 19,623
Disposals (11,200) (4,961) (6,356)
Net investment 2,949 11,690 13,267
OPERATING STATISTICS
2005 2004 2003
Liquids production (thousand b/d) 2,562 2,531 2,121
Gas production (million cf/d) 8,424 8,503 8,613
Total production (thousand boe/d) 4,014 3,997 3,606
Refinery throughputs (thousand b/d) 2,399 2,607 2,723
Marketing sales (thousand b/d) 3,942 4,002 3,969