BP 2005 Annual Report Download - page 172
Download and view the complete annual report
Please find page 172 of the 2005 BP annual report below. You can navigate through the pages in the report by either clicking on the pages listed below, or by using the keyword search tool below to find specific information within the annual report.-
 1
1 -
2
-
3
-
4
-
5
-
6
-
7
-
8
-
9
-
10
-
11
-
12
-
13
-
14
-
15
-
16
-
17
-
18
-
19
-
20
-
21
-
22
-
23
-
24
-
25
-
26
-
27
-
28
-
29
-
30
-
31
-
32
-
33
-
34
-
35
-
36
-
37
-
38
-
39
-
40
-
41
-
42
-
43
-
44
-
45
-
46
-
47
-
48
-
49
-
50
-
51
-
52
-
53
-
54
-
55
-
56
-
57
-
58
-
59
-
60
-
61
-
62
-
63
-
64
-
65
-
66
-
67
-
68
-
69
-
70
-
71
-
72
-
73
-
74
-
75
-
76
-
77
-
78
-
79
-
80
-
81
-
82
-
83
-
84
-
85
-
86
-
87
-
88
-
89
-
90
-
91
-
92
-
93
-
94
-
95
-
96
-
97
-
98
-
99
-
100
-
101
-
102
-
103
-
104
-
105
-
106
-
107
-
108
-
109
-
110
-
111
-
112
-
113
-
114
-
115
-
116
-
117
-
118
-
119
-
120
-
121
-
122
-
123
-
124
-
125
-
126
-
127
-
128
-
129
-
130
-
131
-
132
-
133
-
134
-
135
-
136
-
137
-
138
-
139
-
140
-
141
-
142
-
143
-
144
-
145
-
146
-
147
-
148
-
149
-
150
-
151
-
152
-
153
-
154
-
155
-
156
-
157
-
158
-
159
-
160
-
161
-
 162
162 -
 163
163 -
 164
164 -
 165
165 -
 166
166 -
 167
167 -
 168
168 -
 169
169 -
 170
170 -
 171
171 -
 172
172 -
 173
173 -
 174
174 -
 175
175 -
 176
176 -
 177
177 -
 178
178 -
 179
179 -
 180
180
 |
 |

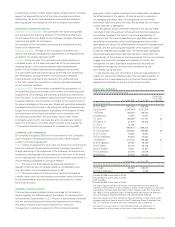
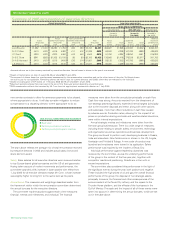
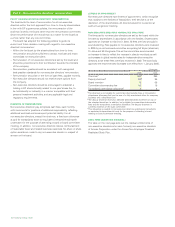
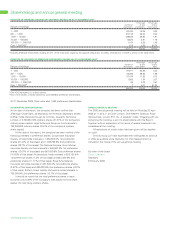
SHARE ELEMENT OF EDIP AND LONG TERM PERFORMANCE PLANS
Under the share element of the EDIP and the Long Term Performance
Plans (LTPPs), performance units were until 2004 granted at the
beginning of the three-year period and converted into an award of
shares at the end of the period, depending on performance. There is
a maximum of two shares per performance unit. For 2005 and future
years, grants of performance shares are made, being the maximum
number of shares that could vest (as described on pages 165-167). In
the table below, performance units that have yet to convert to shares
are expressed as the maximum number of shares into which they
could convert (based on the maximum 2:1 ratio). This achieves
consistency of disclosure between the two periods.
For the 2003-2005 share element of the EDIP and the LTPPs,
BP’s performance was assessed in terms of SHRAM, ROACE and
EPS growth. BP’s three-year SHRAM was measured against the
companies in the FTSE All World Oil & Gas Index. Companies within
the index are weighted according to their market capitalization at
the beginning of each three-year period in order to give greatest
emphasis to oil majors. BP’s ROACE and EPS were measured against
ExxonMobil, Shell, Total and Chevron. Based on a performance
assessment of 75 points out of 200 (0 for SHRAM, 50 for ROACE
and 25 for EPS growth), the committee expects to make awards
of shares to executive directors as highlighted in the 2003-2005 lines
of the table below.
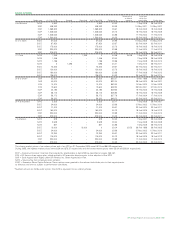
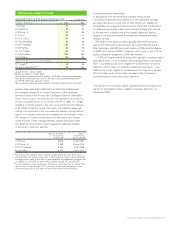
SHARE ELEMENT OF EDIP AND LTPPs
Share element/LTPP interests Interests vested in 2005
Market price Potential maximum
of each share performance sharesaMarket price
Date of at date of award Number of each share
award of of performance of ordinary at vesting
Performance performance shares At 1 Jan Awarded At 31 Dec shares Vesting date
period shares £ 2005 2005 2005 vestedbdate £
Lord Browne 2002–2004 18 Feb 2002 5.73 951,112 – – 356,667 9 Feb 2005 5.49
2003–2005 17 Feb 2003 3.96 1,265,024 – 1,265,024 74,384 expected to vest Feb 2006
2004–2006 25 Feb 2004 4.25 1,268,894 – 1,268,894 – – –
2005–2007 28 April 2005 5.33 – 2,006,767 2,006,767 – – –
Dr D C Allen 2002–2004 6 Mar 2002 5.99 160,000 – – 60,000 9 Feb 2005 5.49
2003–2005 17 Feb 2003 3.96 394,088 – 394,088 147,783 expected to vest Feb 2006
2004–2006 25 Feb 2004 4.25 376,470 – 376,470 – – –
2005–2007 28 Apr 2005 5.33 – 436,623 436,623 – – –
I C Connc2002–2004 6 Mar 2002 5.99 138,000 – – 51,750 9 Feb 2005 5.49
2003–2005 17 Feb 2003 3.96 182,000 – 182,000 68,250 expected to vest Feb 2006
2004–2006 25 Feb 2004 4.25 182,000 – 182,000 – – –
2005–2007 28 Apr 2005 5.33 – 415,832 415,832 – – –
Dr B E Grote 2002–2004 18 Feb 2002 5.73 365,226 – – 136,960 9 Feb 2005 5.49
2003–2005 17 Feb 2003 3.96 467,276 – 467,276 175,229 expected to vest Feb 2006
2004–2006 25 Feb 2004 4.25 425,338 – 425,338 – – –
2005–2007 28 Apr 2005 5.33 – 501,782 501,782 – – –
Dr A B Hayward 2002–2004 6 Mar 2002 5.99 147,000 – – 55,125 9 Feb 2005 5.49
2003–2005 17 Feb 2003 3.96 394,088 – 394,088 147,783 expected to vest Feb 2006
2004–2006 25 Feb 2004 4.25 376,470 – 376,470 – – –
2005–2007 28 Apr 2005 5.33 – 436,623 436,623 – – –
J A Manzoni 2002–2004 6 Mar 2002 5.99 160,000 – – 60,000 9 Feb 2005 5.49
2003–2005 17 Feb 2003 3.96 394,088 – 394,088 147,783 expected to vest Feb 2006
2004–2006 25 Feb 2004 4.25 376,470 – 376,470 – – –
2005–2007 28 Apr 2005 5.33 – 436,623 436,623 – – –
Former directors
R L Olver 2002–2004 18 Feb 2002 5.73 392,592 – – 147,222 9 Feb 2005 5.49
2003–2005 17 Feb 2003 3.96 548,276 – 548,276 205,604 expected to vest Feb 2006
aBP’s performance is measured against the oil sector. For the periods 2003-2005 and 2004-2006, the performance measure is SHRAM, which is measured against
the FTSE All World Oil & Gas Index, and ROACE and EPS growth, which are measured against ExxonMobil, Shell, Total and Chevron. For the 2005-2007 period,
the performance condition is TSR measured against ExxonMobil, Shell, Total and Chevron. Each performance period ends on 31 December of the third year.
bRepresents awards of shares made, or expected to be made, at the end of the relevant performance period based on performance achieved under rules of the plan.
cMr Conn elected to defer to 2006 the determination of whether LTPP awards should be made for the 2000-2002 performance period. As this period ended prior to his
appointment as a director, the expected award is not included in this table.
170 Making energy more