BP 2005 Annual Report Download - page 17
Download and view the complete annual report
Please find page 17 of the 2005 BP annual report below. You can navigate through the pages in the report by either clicking on the pages listed below, or by using the keyword search tool below to find specific information within the annual report.-
 1
1 -
2
-
3
-
4
-
5
-
6
-
 7
7 -
 8
8 -
 9
9 -
 10
10 -
 11
11 -
 12
12 -
 13
13 -
 14
14 -
 15
15 -
 16
16 -
 17
17 -
 18
18 -
 19
19 -
 20
20 -
 21
21 -
 22
22 -
 23
23 -
 24
24 -
 25
25 -
 26
26 -
 27
27 -
28
-
29
-
30
-
31
-
32
-
33
-
34
-
35
-
36
-
37
-
38
-
39
-
40
-
41
-
42
-
43
-
44
-
45
-
46
-
47
-
48
-
49
-
50
-
51
-
52
-
53
-
54
-
55
-
56
-
57
-
58
-
59
-
60
-
61
-
62
-
63
-
64
-
65
-
66
-
67
-
68
-
69
-
70
-
71
-
72
-
73
-
74
-
75
-
76
-
77
-
78
-
79
-
80
-
81
-
82
-
83
-
84
-
85
-
86
-
87
-
88
-
89
-
90
-
91
-
92
-
93
-
94
-
95
-
96
-
97
-
98
-
99
-
100
-
101
-
102
-
103
-
104
-
105
-
106
-
107
-
108
-
109
-
110
-
111
-
112
-
113
-
114
-
115
-
116
-
117
-
118
-
119
-
120
-
121
-
122
-
123
-
124
-
125
-
126
-
127
-
128
-
129
-
130
-
131
-
132
-
133
-
134
-
135
-
136
-
137
-
138
-
139
-
140
-
141
-
142
-
143
-
144
-
145
-
146
-
147
-
148
-
149
-
150
-
151
-
152
-
153
-
154
-
155
-
156
-
157
-
158
-
159
-
160
-
161
-
162
-
163
-
164
-
165
-
166
-
167
-
168
-
169
-
170
-
171
-
172
-
173
-
174
-
175
-
176
-
177
-
178
-
179
-
180
 |
 |

BP Annual Report and Accounts 2005 15
and trading and NGLs businesses. The volumes of gas
supplied into liquefaction plants rose by 1%. Our solar
and power businesses continued to grow profitably.
Gas Our intent is to grow the business in the medium
term by 2-3% a year, in line with global gas demand. North
America, where we continue to hold the largest market
share, is our most important gas market. This position is
anchored by our strong upstream positions around the Gulf
of Mexico, the mid-continent, the Rockies, Canada and
Trinidad & Tobago. We have strong positions in the North
Sea, the Caspian and North Africa that, together with
imports of LNG, give us the opportunity to support Europe’s
move towards cleaner gas-fired heat and power. We have
significant gas sales via pipeline and LNG in Asia.
Our LNG plans remain on track. Our Atlantic basin
LNG business is underpinned by our upstream positions
in Trinidad & Tobago, Egypt and, in future, Angola. We
are bringing this gas to market through investment in
downstream regasification and logistics assets. In the US,
we have long-term capacity agreements in place at Cove
Point, Maryland, for 250 million standard cubic feet per
day (mmscfd) and Elba Island, Georgia, for 150mmscfd.
We are continuing to seek approval to develop a
regasification facility at Crown Landing in New Jersey,
where important progress was made in relation to
associated shipping, environmental and legal matters.
BP also has a long-term contract to supply LNG into the
Dominican Republic.
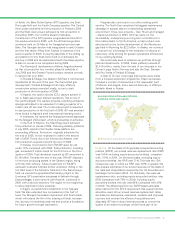
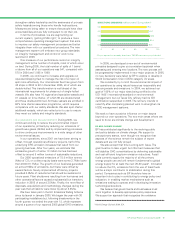
LNG POSITIONS AND MARKETS
LNG resources Major LNG markets
Major trade flow
In the UK, we began to supply LNG cargoes to the
new Isle of Grain terminal where, with Sonatrach, we have
rights to 450mmscfd of capacity. Despite tightness in world
LNG supplies, we were able to source cargoes of LNG
successfully from Trinidad & Tobago and Algeria in response
to increases in UK market prices. In Spain, we are partners
(BP 25%) in the 700mmscfd Bilbao regasification plant and
800MW gas-fired power station. BP supplies LNG cargoes
into the Pacific Basin, including Japan and Taiwan. We have
also started LNG supply into the Gwangyang regasification
terminal in South Korea since its start-up in mid-2005.
Sales into this terminal will be sourced from Tangguh after
will be extended to other countries during 2006. We
formed a joint venture between Castrol and the Dong
Feng group, a Chinese automobile manufacturer, to
supply lubricants to the Chinese market. Our strength in
fast-growth emerging markets depends on strong brands
and focused technological innovation.
BP enjoys strong market shares and leading technologies
in the high-growth A&A business. In Asia, we continue to
develop a strong position in PTA (the main component of
polyester fibres and packaging) and acetic acid (commonly
used for paints, adhesives and inks). Our investment is
biased towards this high-growth region, especially China.
Capital expenditure in our A&A business increased slightly
in 2005 as we invested to maintain our leadership position.
BP and Sinopec Corporation of China signed a joint-
venture contract to build a world-scale acetic acid plant
in Nanjing, Jiangsu province. The 500,000-tonnes-a-year
operation is planned to come on stream in the second half
of 2007. The sale of BP’s 70% shareholding in BP Malaysia
Sdn Bhd to Lembaga Tabung Angkatan (LTAT), announced
in 2004, was successfully concluded during the third quarter
of 2005. We also announced plans for a second PTA plant
at the BP Zhuhai Chemical Company’s site in China’s
Guangdong province, subject to government approval.
The new plant is designed to have an operating capacity
of 900,000 tonnes a year and will be the first plant to
use BP’s new-generation proprietary PTA technology.
In October 2005, we signed a letter of intent with
Hindustan Petroleum Corporation to form a 50:50 strategic
joint venture in the refining and marketing sector in India.
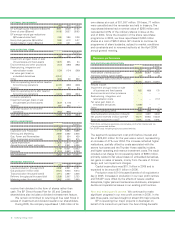
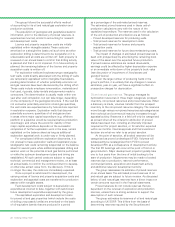
GAS, POWER AND RENEWABLES
$ million
2005 2004 2003
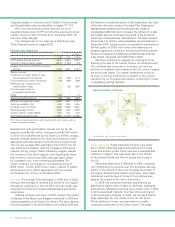
Profit before interest and taxa1,104 954 578
Inventory holding (gains) losses (95) (39) (6)
Replacement cost profit before interest
and tax 1,009 915 572
Results include:
Impairment and gain (loss) on sale of
business and fixed assets 55 56 (6)
Environmental and other provisions 6––
Restructuring, integration and
rationalization costs –––
Fair value gain (loss) on
embedded derivatives (346) – –
Other 265––
Total non-operating items (20) 56 (6)
aProfit from continuing operations and includes profit after interest and tax
of equity-accounted entities.
Replacement cost profit before interest and tax for the
segment for the year was $1,009 million, compared with
$915 million in 2004. The result includes a net charge for
non-operating items of $20 million (2004 $56 million gain),
which primarily comprises fair value losses on embedded
derivatives of $346 million and compensation of $265 million
received on cancellation of an intra-group gas supply
contract. The operating business result has increased by
20% over 2004, with higher margins from gas marketing