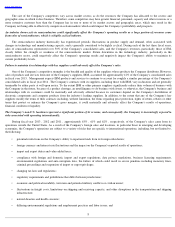
Avnet 2013 Annual Report Download - page 20
Download and view the complete annual report
Please find page 20 of the 2013 Avnet annual report below. You can navigate through the pages in the report by either clicking on the pages listed below, or by using the keyword search tool below to find specific information within the annual report.
Table of Contents
Gross profit margin of 11.7% declined 17 basis points over the prior year. EM gross profit margin declined 52
basis points year over year
due to competitive pressures most notably in the EMEA region and a higher mix of lower margin Asia revenue. TS gross profit margin improved
24
basis points year over year primarily driven by the Americas and EMEA offset by a decrease in Asia. These increases were driven primarily
by the revenue mix of higher margin products and services.
Consolidated operating income margin was 2.5% as compared with 3.4%
in the prior year. Both periods included restructuring, integration
and other charges. Excluding these charges from both periods, operating income margin was 3.0% of sales in fiscal 2013 as compared to 3.7%
of
sales in the prior year. EM operating income margin decreased 90 basis points year over year to 4.1%
. The decline in EM operating income
margin was primarily due to lower profitability in the western regions due to lower gross profit margins, partially offset by the benefit of cost
reduction actions taken. TS operating income margin decreased 27 basis points year over year to 2.7%
due primarily to recent acquisitions as the
related cost synergies have not yet been attained, in particular in EMEA.
Three-Year Analysis of Sales: By Operating Group and Geography
18
Years Ended
Percent Change
June 29,
2013
% of
Total
June 30,
2012
% of
Total
July 2,
2011
% of
Total
2013 to
2012
2012 to
2011
(Dollars in millions)
Sales by Operating
Group:
EM Americas
$
5,263.8
20.7
%
$
5,678.7
22.1
%
$
5,113.8
19.3
%
(7.3
)%
11.0
%
EM EMEA
4,096.0
16.1
4,203.3
16.4
4,816.3
18.1
(2.6
)
(12.7
)
EM Asia
5,734.6
22.5
5,051.1
19.6
5,136.1
19.4
13.5
(1.7
)
Total EM
15,094.4
59.3
14,933.1
58.1
15,066.2
56.8
1.1
(0.9
)
TS Americas
5,452.8
21.4
5,820.6
22.6
6,404.7
24.1
(6.3
)
(9.1
)
TS EMEA
3,181.9
12.5
3,205.6
12.5
3,577.1
13.5
(0.7
)
(10.4
)
TS Asia
1,729.8
6.8
1,748.2
6.8
1,486.4
5.6
(1.1
)
17.6
Total TS
10,364.5
40.7
10,774.4
41.9
11,468.2
43.2
(3.8
)
(6.0
)
Total Avnet, Inc.
$
25,458.9
$
25,707.5
$
26,534.4
(1.0
)%
(3.1
)%
Sales by Geographic
Area:
Americas
$
10,716.6
42.1
%
$
11,499.3
44.8
%
$
11,518.5
43.4
%
(6.8
)%
(0.2
)%
EMEA
7,277.9
28.6
7,408.9
28.8
8,393.4
31.6
(1.8
)
(11.7
)
Asia/Pacific
7,464.4
29.3
6,799.3
26.4
6,622.5
25.0
9.8
2.7
$
25,458.9
$
25,707.5
$
26,534.4


