Avnet 2003 Annual Report Download - page 2
Download and view the complete annual report
Please find page 2 of the 2003 Avnet annual report below. You can navigate through the pages in the report by either clicking on the pages listed below, or by using the keyword search tool below to find specific information within the annual report.-
 1
1 -
 2
2 -
 3
3 -
 4
4 -
 5
5 -
 6
6 -
 7
7 -
 8
8 -
 9
9 -
 10
10 -
 11
11 -
 12
12 -
 13
13 -
14
-
15
-
16
-
17
-
18
-
19
-
20
-
21
-
22
-
23
-
24
-
25
-
26
-
27
-
28
-
29
-
30
-
31
-
32
-
33
-
34
-
35
-
36
-
37
-
38
-
39
-
40
-
41
-
42
-
43
-
44
-
45
-
46
-
47
-
48
-
49
-
50
-
51
-
52
-
53
-
54
-
55
-
56
-
57
-
58
-
59
-
60
-
61
-
62
-
63
-
64
-
65
-
66
-
67
-
68
-
69
-
70
-
71
-
72
-
73
-
74
-
75
-
76
-
77
-
78
-
79
-
80
-
81
-
82
-
83
-
84
-
85
-
86
-
87
-
88
-
89
-
90
-
91
-
92
-
93
 |
 |

At Avnet, we provide value to our customers
by delivering distinctive services and technology
products that enhance their business growth
and profitability. We provide value to our
suppliers by building efficient channels to
target markets and offering innovative services
that accelerate their growth. We are ‘Enabling
Success at the Center of Technology.’
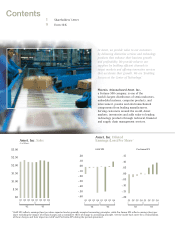
Phoenix, Arizona-based Avnet, Inc.,
a Fortune 500 company, is one of the
world’s largest distributors of semiconductors,
embedded systems, computer products, and
interconnect, passive and electromechanical
components from leading manufacturers.
Serving customers around the world, Avnet
markets, inventories and adds value to leading
technology products through technical, financial
and supply chain management services.
1Shareholders’ Letter
9Form 10-K
Contents
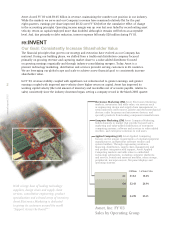
Avnet, Inc. Diluted
Earnings (Loss) Per Share*
.15
.10
.05
.00
-.05
-.10
-.15
-.20
Q1 Q2 Q3 Q4 Q1 Q2 Q3 Q4
’02 ’03
.20
.10
.00
-.10
-.20
-.30
-.40
-.50
-.60
Q1 Q2 Q3 Q4 Q1 Q2 Q3 Q4
’02 ’03
Avnet, Inc. Sales
($ in Billions)
$3.00
$2.50
$2.00
$1.50
$1.00
$.50
$0
Q1 Q2 Q3 Q4 Q1 Q2 Q3 Q4
’02 ’03
GAAP EPS reflects earnings (loss) per share reported under generally accepted accounting principles, while Pro Forma EPS reflects earnings (loss) per
share excluding the impact of certain charges and a cumulative effect of change in accounting principle. See the inside back cover for a reconciliation
of these charges and their impact on GAAP and Pro Forma EPS during the periods presented.
GAAP EPS Pro Forma EPS
*