Aviva 2013 Annual Report Download - page 8
Download and view the complete annual report
Please find page 8 of the 2013 Aviva annual report below. You can navigate through the pages in the report by either clicking on the pages listed below, or by using the keyword search tool below to find specific information within the annual report.-
 1
1 -
 2
2 -
 3
3 -
 4
4 -
 5
5 -
 6
6 -
 7
7 -
 8
8 -
 9
9 -
 10
10 -
 11
11 -
 12
12 -
 13
13 -
 14
14 -
 15
15 -
 16
16 -
 17
17 -
 18
18 -
 19
19 -
20
-
21
-
22
-
23
-
24
-
25
-
26
-
27
-
28
-
29
-
30
-
31
-
32
-
33
-
34
-
35
-
36
-
37
-
38
-
39
-
40
-
41
-
42
-
43
-
44
-
45
-
46
-
47
-
48
-
49
-
50
-
51
-
52
-
53
-
54
-
55
-
56
-
57
-
58
-
59
-
60
-
61
-
62
-
63
-
64
-
65
-
66
-
67
-
68
-
69
-
70
-
71
-
72
-
73
-
74
-
75
-
76
-
77
-
78
-
79
-
80
-
81
-
82
-
83
-
84
-
85
-
86
-
87
-
88
-
89
-
90
-
91
-
92
-
93
-
94
-
95
-
96
-
97
-
98
-
99
-
100
-
101
-
102
-
103
-
104
-
105
-
106
-
107
-
108
-
109
-
110
-
111
-
112
-
113
-
114
-
115
-
116
-
117
-
118
-
119
-
120
-
121
-
122
-
123
-
124
-
125
-
126
-
127
-
128
-
129
-
130
-
131
-
132
-
133
-
134
-
135
-
136
-
137
-
138
-
139
-
140
-
141
-
142
-
143
-
144
-
145
-
146
-
147
-
148
-
149
-
150
-
151
-
152
-
153
-
154
-
155
-
156
-
157
-
158
-
159
-
160
-
161
-
162
-
163
-
164
-
165
-
166
-
167
-
168
-
169
-
170
-
171
-
172
-
173
-
174
-
175
-
176
-
177
-
178
-
179
-
180
-
181
-
182
-
183
-
184
-
185
-
186
-
187
-
188
-
189
-
190
-
191
-
192
-
193
-
194
-
195
-
196
-
197
-
198
-
199
-
200
-
201
-
202
-
203
-
204
-
205
-
206
-
207
-
208
-
209
-
210
-
211
-
212
-
213
-
214
-
215
-
216
-
217
-
218
-
219
-
220
-
221
-
222
-
223
-
224
-
225
-
226
-
227
-
228
-
229
-
230
-
231
-
232
-
233
-
234
-
235
-
236
-
237
-
238
-
239
-
240
-
241
-
242
-
243
-
244
-
245
-
246
-
247
-
248
-
249
-
250
-
251
-
252
-
253
-
254
-
255
-
256
-
257
-
258
-
259
-
260
-
261
-
262
-
263
-
264
-
265
-
266
-
267
-
268
-
269
-
270
-
271
-
272
-
273
-
274
-
275
-
276
-
277
-
278
-
279
-
280
-
281
-
282
-
283
-
284
-
285
-
286
-
287
-
288
-
289
-
290
-
291
-
292
-
293
-
294
-
295
-
296
-
297
-
298
-
299
-
300
-
301
-
302
-
303
-
304
-
305
-
306
-
307
-
308
-
309
-
310
-
311
-
312
-
313
-
314
-
315
-
316
-
317
-
318
-
319
-
320
 |
 |

Aviva plc
Annual report and accounts 2013
6
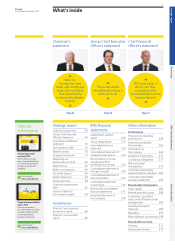
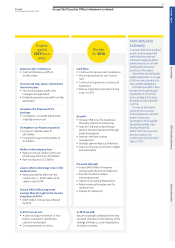
Group Chief Executive Ofcer’s statement
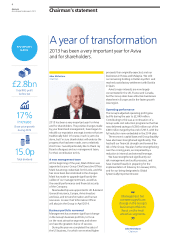
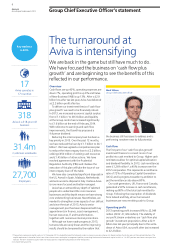
Key statistics
in 2013
17
Aviva operates in
17 countries
318
Aviva is a 318-year-old
business
31.4m
Customers worldwide
27,700
Employees
The turnaround at
Aviva is intensifying
We are back in the game but still have much to do.
We have focused the business on ‘cash ow plus
growth’ and are beginning to see the benets of this
reected in our performance.
Mark Wilson
Group Chief Executive Ofcer
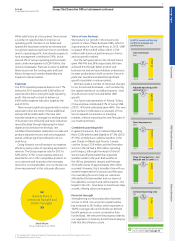
Overview
Cash ows are up 40%, operating expenses are
down 7%, operating prot is up 6% and Value
of New Business (VNB) is up 13%. After a £2.9
billion loss after tax last year, Aviva has delivered
a £2.2 billion prot after tax.
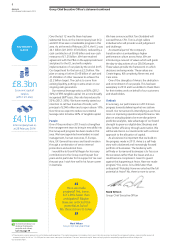
To deliver our investment thesis of ‘cash ow
plus growth’ we need to be nancially robust.
In 2013, we increased economic capital surplus
from £7.1 billion¹ to £8.3 billion and liquidity
at the Group centre has increased signicantly
to £1.6 billion at the end of February 2014.
With reference to earnings and cash ow
improvements, the Board has proposed a
9.4 pence dividend.
Reducing the intercompany loan has been a
key priority in 2013. Over the past 12 months,
we have reduced the loan by £1.7 billion to £4.1
billion². We have agreed a comprehensive plan
to reduce the intercompany loan to £2.2 billion,
utilising £450 million of existing cash resources
and £1.45 billion of other actions. We have
reached agreement with the Prudential
Regulation Authority (PRA) and I believe the
execution of this plan will take the issue of our
intercompany loan off the table.
We have also completed signicant disposals in
the US, Aseval in Spain, Malaysia, Netherlands
and announced a disposal in Italy. I believe Aviva
is now more focused and better managed.
Aviva has an extraordinary depth of talented
people who understand the core insurance
businesses and this depth means we have strong
core underwriting businesses. Nevertheless, we
needed to strengthen some aspects of our skill set
and since the start of 2013, Aviva’s senior
management pool has been deepened with key
appointments in nance, asset management,
human resources, IT and transformation,
together with numerous internal promotions.
Although we have made progress in 2013,
turnarounds are rarely linear and the improving
results should be tempered by the realism that
the business still has issues to address and is
performing nowhere near its full potential.
Cash ow
The rst part of our ‘cash ow plus growth’
investment thesis is to convert more of our
prots into cash remitted to Group. Higher cash
remittances allow for optimal capital allocation
and dividend exibility. In 2013, cash remittances
were £1,269 million³, a 40% increase over the
2012 comparative. This represents a remittance
ratio of 72% of Operating Capital Generation
(OCG) and is progress towards my ambition to
get the remittance ratio above 80%.
Our cash generators, UK, France and Canada,
generated a 59% increase in cash remittances,
making up 80% of the total cash remitted to
Group. Following the resumption of dividends
from Ireland and Italy, all our turnaround
businesses are now remitting cash to Group.
Operating prot
2013 operating prot increased 6% to £2,049
million (2012: £1,926 million). The stability of
our prot stream underlines our ‘cash ow plus
growth’ investment proposition. After a £2.9
billion loss last year principally due to the write-
down of Aviva USA, our prot after tax increased
to £2.2 billion.
1 The pro forma economic capital surplus at 31 December 2012 included the benet of disposals and an increase in pension scheme risk allowance from ve to ten years of stressed contributions. The
capital requirement is based on Aviva’s own internal assessment and capital management policies, measuring the amount of economic capital at risk in a 1-in-200 year loss event over a one year time
horizon. The term ‘economic capital’ does not imply capital as required by regulators or other third parties.
2 At end of February 2014.