Atari 2011 Annual Report Download - page 4
Download and view the complete annual report
Please find page 4 of the 2011 Atari annual report below. You can navigate through the pages in the report by either clicking on the pages listed below, or by using the keyword search tool below to find specific information within the annual report.-
 1
1 -
 2
2 -
 3
3 -
 4
4 -
 5
5 -
 6
6 -
 7
7 -
 8
8 -
 9
9 -
 10
10 -
 11
11 -
 12
12 -
 13
13 -
 14
14 -
 15
15 -
16
-
17
-
18
-
19
-
20
-
21
-
22
-
23
-
24
-
25
-
26
-
27
-
28
-
29
-
30
-
31
-
32
-
33
-
34
-
35
-
36
-
37
-
38
-
39
-
40
-
41
-
42
-
43
-
44
-
45
-
46
-
47
-
48
-
49
-
50
-
51
-
52
-
53
-
54
-
55
-
56
-
57
-
58
-
59
-
60
-
61
-
62
-
63
-
64
-
65
-
66
-
67
-
68
-
69
-
70
-
71
-
72
-
73
-
74
-
75
-
76
-
77
-
78
-
79
-
80
-
81
-
82
-
83
-
84
-
85
-
86
-
87
-
88
-
89
-
90
-
91
-
92
-
93
-
94
-
95
-
96
-
97
-
98
-
99
-
100
-
101
-
102
-
103
-
104
-
105
-
106
-
107
-
108
-
109
-
110
-
111
-
112
-
113
-
114
-
115
-
116
-
117
-
118
-
119
-
120
-
121
-
122
-
123
-
124
-
125
-
126
-
127
-
128
-
129
-
130
-
131
-
132
-
133
-
134
-
135
-
136
-
137
-
138
-
139
-
140
-
141
-
142
-
143
-
144
-
145
-
146
-
147
-
148
-
149
-
150
-
151
-
152
-
153
-
154
-
155
-
156
-
157
-
158
-
159
-
160
 |
 |

ANNUAL FINANCIAL REPORT – REGISTRATION DOCUMENT
4
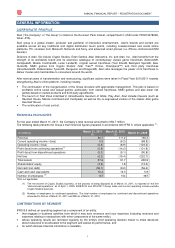
GENERAL INFORMATION
CORPORATE PROFILE
Atari (“the Company” or “the Group”) is listed on the Euronext Paris market, compartment C (ISIN code: FR0010478248,
ticker: ATA).
Atari group is a global creator, producer and publisher of interactive entertainment. Atari's brands and content are
available across all key traditional and digital distribution touch points, including browser-based and social online
platforms, PC, consoles from Microsoft, Nintendo and Sony, and advanced smart phones (i.e. iPhone, Android and RIM
devices).
Divisions of Atari, SA include Cryptic Studios, Eden Games, Atari Interactive, Inc. and Atari, Inc. Atari benefits from the
strength of its worldwide brand and its extensive catalogue of contemporary classic game franchises (Asteroids®,
Centipede®, Missile Command®, Lunar Lander®), original owned franchises (Test Drive®, Backyard Sports®, Deer
Hunter®), MMO games from Cryptic Studios (Star Trek™ Online, Champions™) and third party franchises
(Ghostbusters®, Rollercoaster Tycoon®, Dungeons and Dragons®). Atari also leverages the power of its franchises to
deliver movies and merchandise to consumers around the world.
After several years of transformation and restructuring, significant actions were taken in Fiscal Year 2010/2011 towards
strengthening Atari’s online platform, including notably:
• The continuation of the reorganization of the Group structure with appropriate management. This plan is based on
profitable online social and casual games, particularly from owned franchises, MMO games and also lower risk
games based on owned products and third party agreements;
• The launch of Test Drive Unlimited 2, Ghostbusters Sanctum of Slime, Play Atari, Atari Arcade Classics (such as
Haunted House, Missile Command and Centipede) as well as the re-engineered version of the classic Atari game
Haunted House;
• The continuation of cost control.
FINANCIAL HIGHLIGHTS
For the year ended March 31, 2011, the Company’s total revenue amounted to €56.7 million.
The following table presents the Group’s main financial figures prepared in accordance with IFRS 5, where applicable
(1)
:
(€ millions) March 31, 2011
(1)
March 31, 2010
(1)
March 31, 2009
Revenue 56.7
111.2
136.4
Current operating income / (loss) 0.5
(6.2)
(68.9)
Operating income / (loss) (0.4)
(8.9)
(123.2)
Profit (loss) from continuing operations
(
1
)
(0.9)
(14.2)
(131.9)
Profit (loss) from discontinued operations (5.3)
(9.1)
(90.8)
Net loss (6.2)
(19.4)
(222.7)
Total assets 97.6
91.7
209.9
Shareholders’ equity (3.8)
1.8
(13.3)
Net cash/(net debt) (36.1)
(9.2)
(56.4)
Cash and cash equivalents 16.4
10.3
5.9
Number of employees
(2
)
147
154
387
*N/A: not applicable.
(1) The net income of Cryptic Studios business, in the process of being disposed as of March 31, 2011, is reported on the line
“discontinued operations” as of April 1, 2009. 2009/2010 and 2010/2011 Group sales and current operating income exclude
Cryptic Studios business.
(2) Number of employees for continued operations. The total number of employees for continued and discontinued operations
amounted to 354 as of March 31, 2011 and 380 as of March 31, 2010.
CONTRIBUTIONS BY SEGMENT
IFRS 8.5 defines an operating segment as a component of an entity:
• that engages in business activities from which it may earn revenues and incur expenses (including revenues and
expenses relating to transactions with other components of the same entity),
• whose operating results are reviewed regularly by the entity's chief operating decision maker to make decisions
about resources to be allocated to the segment and assess its performance, and
• for which discrete financial information is available.