Atari 2011 Annual Report Download - page 13
Download and view the complete annual report
Please find page 13 of the 2011 Atari annual report below. You can navigate through the pages in the report by either clicking on the pages listed below, or by using the keyword search tool below to find specific information within the annual report.-
 1
1 -
2
-
 3
3 -
 4
4 -
 5
5 -
 6
6 -
 7
7 -
 8
8 -
 9
9 -
 10
10 -
 11
11 -
 12
12 -
 13
13 -
 14
14 -
 15
15 -
 16
16 -
 17
17 -
 18
18 -
 19
19 -
 20
20 -
 21
21 -
 22
22 -
 23
23 -
24
-
25
-
26
-
27
-
28
-
29
-
30
-
31
-
32
-
33
-
34
-
35
-
36
-
37
-
38
-
39
-
40
-
41
-
42
-
43
-
44
-
45
-
46
-
47
-
48
-
49
-
50
-
51
-
52
-
53
-
54
-
55
-
56
-
57
-
58
-
59
-
60
-
61
-
62
-
63
-
64
-
65
-
66
-
67
-
68
-
69
-
70
-
71
-
72
-
73
-
74
-
75
-
76
-
77
-
78
-
79
-
80
-
81
-
82
-
83
-
84
-
85
-
86
-
87
-
88
-
89
-
90
-
91
-
92
-
93
-
94
-
95
-
96
-
97
-
98
-
99
-
100
-
101
-
102
-
103
-
104
-
105
-
106
-
107
-
108
-
109
-
110
-
111
-
112
-
113
-
114
-
115
-
116
-
117
-
118
-
119
-
120
-
121
-
122
-
123
-
124
-
125
-
126
-
127
-
128
-
129
-
130
-
131
-
132
-
133
-
134
-
135
-
136
-
137
-
138
-
139
-
140
-
141
-
142
-
143
-
144
-
145
-
146
-
147
-
148
-
149
-
150
-
151
-
152
-
153
-
154
-
155
-
156
-
157
-
158
-
159
-
160
 |
 |

ANNUAL FINANCIAL REPORT – REGISTRATION DOCUMENT
13
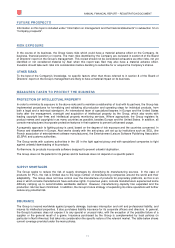
SIMPLIFIED GROUP ORGANIZATION CHART AS OF MARCH 31, 2011
(1)
(1) Cryptic Studios business was in the process of being disposed as of March 31, 2011. As of March 31, 2011, the Company
still owned 100% of Cryptic Studios.
INFORMATION ON MANAGEMENT AND THE FINANCIAL STATEMENTS
Year ended March 31, 2011
BOARD OF DIRECTORS’ REPORT ON THE GROUP’S MANAGEMENT
1. ECONOMIC ENVIRONMENT AND HIGHLIGHTS OF THE YEAR
1.1. ECONOMIC ENVIRONMENT
Atari (“the Company" or “the Group”) is one of the world's famous developers and publishers of interactive game
software. Global market trends are described below based on February 2011 IDG report.
Global market overview (Source: IDG – February 2011)
Worldwide market (Source: IDG – February 2011)
IDG estimates that in calendar year 2010, all major territories experienced a marginal decline in traditional video game
revenue (hardware and software). IDG estimates that worldwide traditional video game revenues raised USD 37.5 billion
in 2010, with a 10% decline in North America and a 9% decline versus prior year in Western Europe. Overall, worldwide
traditional game market is expected to decline by 12% in 2011 when compared to 2010.
In all the major territories, the decline was led by weakness in hardware sales, despite the launch of 2 key higher priced
SKUs that bundled Kinect and Move.
Europe temporarily surpassed the US (on a USD basis) in 2007 and 2008, but in 2010, the US was once again the
largest market for traditional video game revenue accounting for 45% of market share—the same as in 2009.
As per IDG report published in February 2011, on the traditional game segment, downloadable content (DLC) will
continue to grow share as percentage of total market, with Xbox Live, as well as PSN subscription and download
revenues that will increase as a material driver in the market.
In addition, used games and non-traditional digital offerings will increase cannibalization of traditional value/catalog
bracket.
IDG also estimates that mobile gaming will grow strongly on the heels of broader iOS gaming adoption (iPad 2 and