Assurant 2010 Annual Report Download - page 2
Download and view the complete annual report
Please find page 2 of the 2010 Assurant annual report below. You can navigate through the pages in the report by either clicking on the pages listed below, or by using the keyword search tool below to find specific information within the annual report.-
 1
1 -
 2
2 -
 3
3 -
 4
4 -
 5
5 -
 6
6 -
 7
7 -
 8
8 -
 9
9 -
 10
10 -
 11
11 -
 12
12 -
 13
13 -
14
-
15
-
16
-
17
-
18
-
19
-
20
-
21
-
22
-
23
-
24
-
25
-
26
-
27
-
28
-
29
-
30
-
31
-
32
-
33
-
34
-
35
-
36
-
37
-
38
-
39
-
40
-
41
-
42
-
43
-
44
-
45
-
46
-
47
-
48
-
49
-
50
-
51
-
52
-
53
-
54
-
55
-
56
-
57
-
58
-
59
-
60
-
61
-
62
-
63
-
64
-
65
-
66
-
67
-
68
-
69
-
70
-
71
-
72
-
73
-
74
-
75
-
76
-
77
-
78
-
79
-
80
-
81
-
82
-
83
-
84
-
85
-
86
-
87
-
88
-
89
-
90
-
91
-
92
-
93
-
94
-
95
-
96
-
97
-
98
-
99
-
100
-
101
-
102
-
103
-
104
-
105
-
106
-
107
-
108
-
109
-
110
-
111
-
112
-
113
-
114
-
115
-
116
-
117
-
118
-
119
-
120
-
121
-
122
-
123
-
124
-
125
-
126
-
127
-
128
-
129
-
130
-
131
-
132
-
133
-
134
-
135
-
136
-
137
-
138
 |
 |

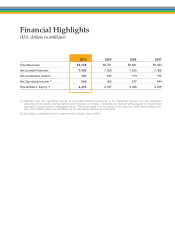
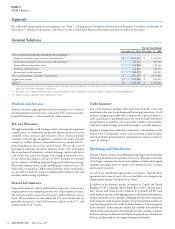
Financial Highlights
(U.S. dollars in millions)
(1) Assurant uses net operating income (a non-GAAP fi nancial measure) as an important measure of the company’s
operating performance. Net operating income equals net income, excluding net realized gains (losses) on investments
and other unusual and/or infrequent items. Please see page 4 at the back of this Assurant 2010 Annual Report for
more information and a reconciliation of net operating income to net income.
(2) Excluding accumulated other comprehensive income (loss) (AOCI).
2010 2009 2008 2007
Total Revenues $8,528 $8,701 $8,601 $8,454
Net Earned Premiums 7,403 7,550 7,925 7,408
Net Investment Income 703 699 774 799
Net Operating Income (1) 560 465 637 694
Shareholders’ Equity (2) 4,495 4,787 4,380 4,035