Ameriprise 2008 Annual Report Download - page 4
Download and view the complete annual report
Please find page 4 of the 2008 Ameriprise annual report below. You can navigate through the pages in the report by either clicking on the pages listed below, or by using the keyword search tool below to find specific information within the annual report.-
 1
1 -
 2
2 -
 3
3 -
 4
4 -
 5
5 -
 6
6 -
 7
7 -
 8
8 -
 9
9 -
 10
10 -
 11
11 -
 12
12 -
 13
13 -
 14
14 -
 15
15 -
16
-
17
-
18
-
19
-
20
-
21
-
22
-
23
-
24
-
25
-
26
-
27
-
28
-
29
-
30
-
31
-
32
-
33
-
34
-
35
-
36
-
37
-
38
-
39
-
40
-
41
-
42
-
43
-
44
-
45
-
46
-
47
-
48
-
49
-
50
-
51
-
52
-
53
-
54
-
55
-
56
-
57
-
58
-
59
-
60
-
61
-
62
-
63
-
64
-
65
-
66
-
67
-
68
-
69
-
70
-
71
-
72
-
73
-
74
-
75
-
76
-
77
-
78
-
79
-
80
-
81
-
82
-
83
-
84
-
85
-
86
-
87
-
88
-
89
-
90
-
91
-
92
-
93
-
94
-
95
-
96
-
97
-
98
-
99
-
100
-
101
-
102
-
103
-
104
-
105
-
106
-
107
-
108
-
109
-
110
-
111
-
112
-
113
-
114
-
115
-
116
-
117
-
118
-
119
-
120
-
121
-
122
-
123
-
124
-
125
-
126
-
127
-
128
-
129
-
130
-
131
-
132
-
133
-
134
-
135
-
136
-
137
-
138
-
139
-
140
-
141
-
142
-
143
-
144
-
145
-
146
-
147
-
148
-
149
-
150
-
151
-
152
-
153
-
154
-
155
-
156
-
157
-
158
-
159
-
160
-
161
-
162
-
163
-
164
-
165
-
166
-
167
-
168
-
169
-
170
-
171
-
172
-
173
-
174
-
175
-
176
-
177
-
178
-
179
-
180
-
181
-
182
-
183
-
184
 |
 |
2 Ameriprise Financial 2008 Annual Report
lowering fee revenue. As our clients sought safety,
their desire for conservative investment products,
as well as their reduced activity, further impacted
our revenue. Credit market instability resulted in
impairments to our investment portfolio. And we took
necessary steps to position the company for our lower
2009 market expectations, which led to significant
non-cash charges late in the year. These market
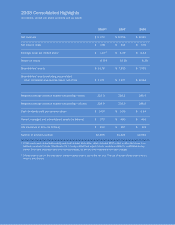
forces drove our $38 million loss for the full year.
While our results were disappointing, I am encouraged
by the continued strength of our business model.
At the heart of our company are long-lasting, personal
and deep client-advisor relationships. These relation-
ships remain as strong as ever, for many reasons:
because of the excellent support we provide to
advisors and clients; because of our advisors’ personal
commitment to their clients; because of our unique
comprehensive approach to financial planning; and
because our broad and innovative product offerings
provide a range of solutions to meet clients’ goals.
Our advisor support continues to be extensive. Early
in the year, we brought about 8,000 of our advisors
to our Minneapolis headquarters for training to help
them deliver a more consistent and compelling client
experience by using new products, services and tech-
nology. As the markets deteriorated later in the year,
we developed a new online market resource center
to help advisors provide current information to their
clients. In addition, we broadened market resources
and perspectives on our public website. As a result
of these and other efforts, our client retention remains
strong and our advisor retention is at an all-time high.
Strong Balance Sheet
Fundamentals
• $34 billion diversied asset portfolio,
including $6 billion in cash and cash
equivalents
• $0.7 billion in excess capital
• Conservative debt ratios