Ameriprise 2008 Annual Report Download - page 2
Download and view the complete annual report
Please find page 2 of the 2008 Ameriprise annual report below. You can navigate through the pages in the report by either clicking on the pages listed below, or by using the keyword search tool below to find specific information within the annual report.-
 1
1 -
 2
2 -
 3
3 -
 4
4 -
 5
5 -
 6
6 -
 7
7 -
 8
8 -
 9
9 -
 10
10 -
 11
11 -
 12
12 -
 13
13 -
14
-
15
-
16
-
17
-
18
-
19
-
20
-
21
-
22
-
23
-
24
-
25
-
26
-
27
-
28
-
29
-
30
-
31
-
32
-
33
-
34
-
35
-
36
-
37
-
38
-
39
-
40
-
41
-
42
-
43
-
44
-
45
-
46
-
47
-
48
-
49
-
50
-
51
-
52
-
53
-
54
-
55
-
56
-
57
-
58
-
59
-
60
-
61
-
62
-
63
-
64
-
65
-
66
-
67
-
68
-
69
-
70
-
71
-
72
-
73
-
74
-
75
-
76
-
77
-
78
-
79
-
80
-
81
-
82
-
83
-
84
-
85
-
86
-
87
-
88
-
89
-
90
-
91
-
92
-
93
-
94
-
95
-
96
-
97
-
98
-
99
-
100
-
101
-
102
-
103
-
104
-
105
-
106
-
107
-
108
-
109
-
110
-
111
-
112
-
113
-
114
-
115
-
116
-
117
-
118
-
119
-
120
-
121
-
122
-
123
-
124
-
125
-
126
-
127
-
128
-
129
-
130
-
131
-
132
-
133
-
134
-
135
-
136
-
137
-
138
-
139
-
140
-
141
-
142
-
143
-
144
-
145
-
146
-
147
-
148
-
149
-
150
-
151
-
152
-
153
-
154
-
155
-
156
-
157
-
158
-
159
-
160
-
161
-
162
-
163
-
164
-
165
-
166
-
167
-
168
-
169
-
170
-
171
-
172
-
173
-
174
-
175
-
176
-
177
-
178
-
179
-
180
-
181
-
182
-
183
-
184
 |
 |

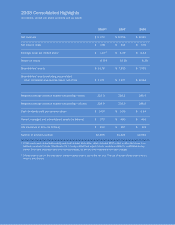
2008 Consolidated Highlights
(in millions, except per share amounts and as noted)
2008
(1) 2007 2006
Net revenues $ 6,970 $ 8,556 $ 8,026
Net income (loss) $ (38 ) $ 814 $ 631
Earnings (loss) per diluted share $ (.17 )(2) $ 3.39 $ 2.54
Return on equity (0.5 )
% 10.5 % 8.3 %
Shareholders’ equity $ 6,178 $ 7,810 $ 7,925
Shareholders’ equity excluding accumulated
other comprehensive income (loss), net of tax $ 7,271 $ 7,977 $ 8,134
Weighted average common shares outstanding — basic 222.3 236.2 246.5
Weighted average common shares outstanding — diluted 224.9 239.9 248.5
Cash dividends paid per common share $ 0.64 $ 0.56 $ 0.44
Owned, managed and administered assets (in billions) $ 372 $ 480 $ 466
Life insurance in force (in billions) $ 192 $ 187 $ 174
Number of advisors (actual) 12,486 11,824 12,592
(1) 2008 results were impacted by equity and credit market dislocation, which included $917 million in after-tax losses from
realized investment losses, RiverSource 2a-7 money market fund support costs, expenses related to unaffiliated money
market funds and integration and restructuring charges, as well as other substantial non-cash charges.
(2) Diluted shares used in this calculation represent basic shares due to the net loss. The use of actual diluted shares would
result in anti-dilution.